Deploying DataScribe to Create a New Dataset for American Religious History
At the heart of the American Religious Ecologies project are currently two endeavors: (1) photographing and making available approximately 232,000 schedules from the 1926 Census of Religious Bodies, and (2) creating spatially-linked datasets that can tell us about America’s religious life in the early twentieth century. However, there is a big difference between simply presenting digitized sources online and generating a dataset that can be computationally analyzed and visualized. With 40,000 schedules now digitized and available on our website, we’ve been thinking a lot about how to transform our digitized sources into a dataset, and how to utilize DataScribe—the newest transcription software from the Roy Rosenzweig Center for History and New Media (RRCHNM)—to facilitate this process.
The process of transforming historical sources into a dataset is often two-fold. First one must transcribe text or numbers from the document, or in this case, type a copy of the text and numbers into the computer, so that they become machine-readable. Second, one must organize and give structure to this text in order to transform it into data. Documents that are filled out by humans—like our 1926 census schedules—naturally have small variations in them. For example, one congregation might use text to record that they have “one” church building, while another might represent this data with a numeral “1” instead. When looking at a single document, these variations are not significant. But when you want to analyze or visualize thousands of the documents by looking at a single variable—say number of church buildings—these variations become more problematic.
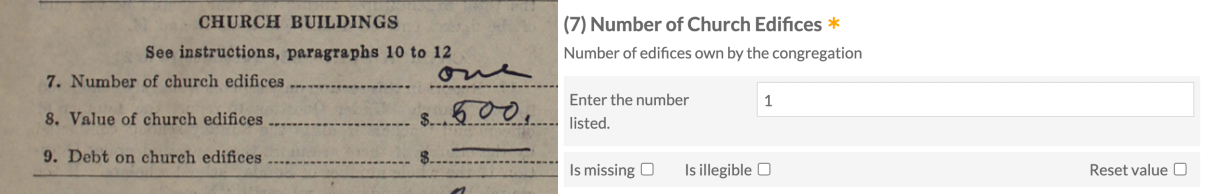
Figure 1. Side by side images of “one” being written out on the form and “1” being entered in the form to show the different way data was written on the schedules.
For many years, historians have been interested in sources—like the 1926 census schedules we are digitizing—which contain quantitative information or statistics. To record these details and make use of them, scholars utilized software (or even just spreadsheets) that only really helped with the first part of the transformation process—transcription. Nevertheless, over the past eighteen months a team at RRCHNM has been hard at work to create DataScribe, a new transcription software developed specifically to help transform historical sources with quantitative information into datasets.
So what is so great about DataScribe, and why are we thrilled to be one of the first major projects using it?
DataScribe is well-suited to our sources and project goals.
The main historical sources we are currently using are schedules from the 1926 Census of Religious Bodies. These single-page documents contain a form (to be filled out by a single congregation) that asks a number of questions about a congregation’s membership, leadership, building, finances, and educational programs. (See our earlier post about what you can learn from a Religious Bodies census schedule.) This means that each schedule contains a great deal of quantitative information that can be recorded and organized by fields—generally one for each question on the schedule. DataScribe was specifically designed for this type of project—to record quantitative information from sources like the 1926 Census of Religious Bodies and help scholars transform that information into datasets for analysis and visualization. American Religious Ecologies is just one example of the many kinds of digital humanities projects that are transcribing structured data.
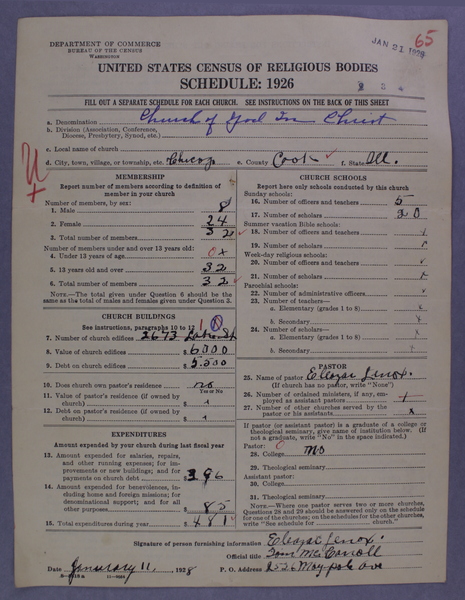
Figure 2. An example of a schedule from the Census. This schedule is from a Church of God in Christ located in Chicago, Illinois.
DataScribe helps us transcribe our data in a structured way.
DataScribe lets us both transcribe and standardize our data—in effect allowing us to undertake both steps in the transformation process at once. Before DataScribe, we, like many others, started out transcribing our data in spreadsheets, with one column for every field listed on the schedule (total number of members, total expenditures, name of pastor, etc.) and one row for every schedule or congregation. In an attempt to try to standardize the data, we created a long list of rules that dictated how transcribers should interpret and transcribe the various entries for each field. For example, if a field was left blank, transcribers were to enter “NA” to indicate a null field. If a number was given, whether in textual or numeric form, they were instructed to enter it as a number. If the congregation wrote “none,” transcribers were asked to enter this as “0.” Throughout this process, it was easy to forget a rule, make a mistake or include a typo.
However, DataScribe allows us to build our own transcription form. In this form, we can include instructions that will be shown in the transcription interface, dictate what type of data is acceptable, and in some cases, offer concrete choices to transcribers. For example, we can pre-determine that membership statistics should be entered as numbers and disallow any other type of input for those fields. Or, we can create a categorical variable by having transcribers pick “Urban” or “Rural” with radio buttons instead of entering “U” or “R” in a text box. These options help us standardize our data, keep transcription errors to a minimum, and make each field easier to analyze or visualize.
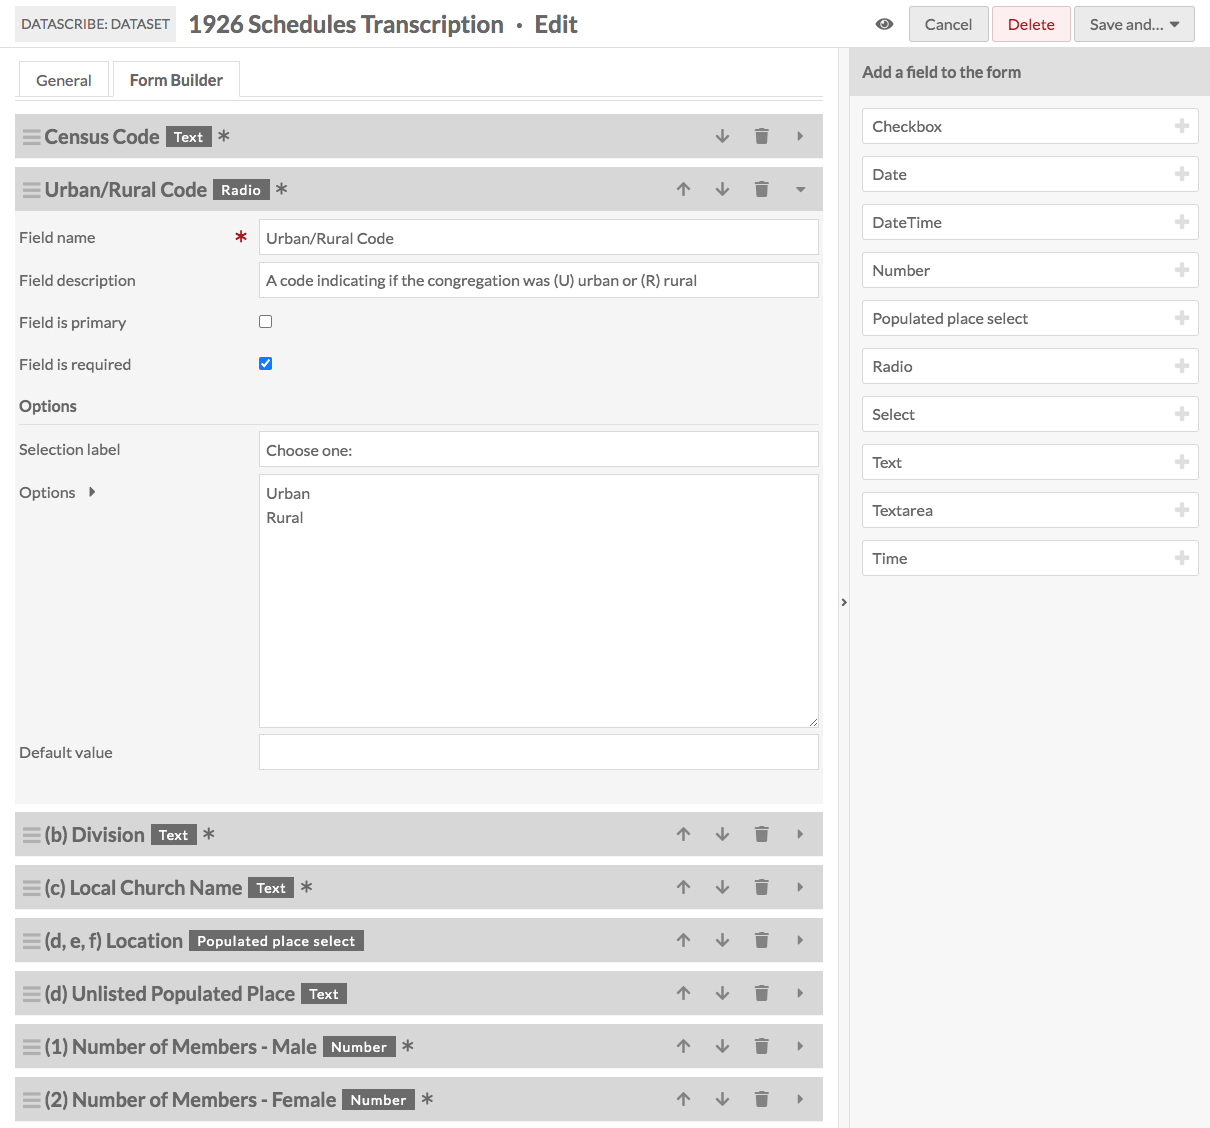
Figure 3. Screenshot from Datascribe of the form builder for transcribing.
DataScribe helps us create a spatially linked dataset that can be easily mapped.
One of the key pieces of information included on each schedule is the location of the congregation. This is recorded on the schedule in three fields: State, County, and City, town, village or township. This is inherently spatial data. But by simply transcribing the text, there is no connection between the place name and its geospatial location. Using DataScribe we have created what we call a “Populated Place” field, which draws on a spatial dataset of almost 200,000 U.S. place names. The “Populated Place” field lets the transcriber choose the congregation’s location from a series of dropdown menus. However, when DataScribe saves this input, it does not just record the text of that place name; instead it records a six-digit spatial code that helps link that place to specific latitude and longitude coordinates. This makes it possible to digitally map the locations of these congregations.
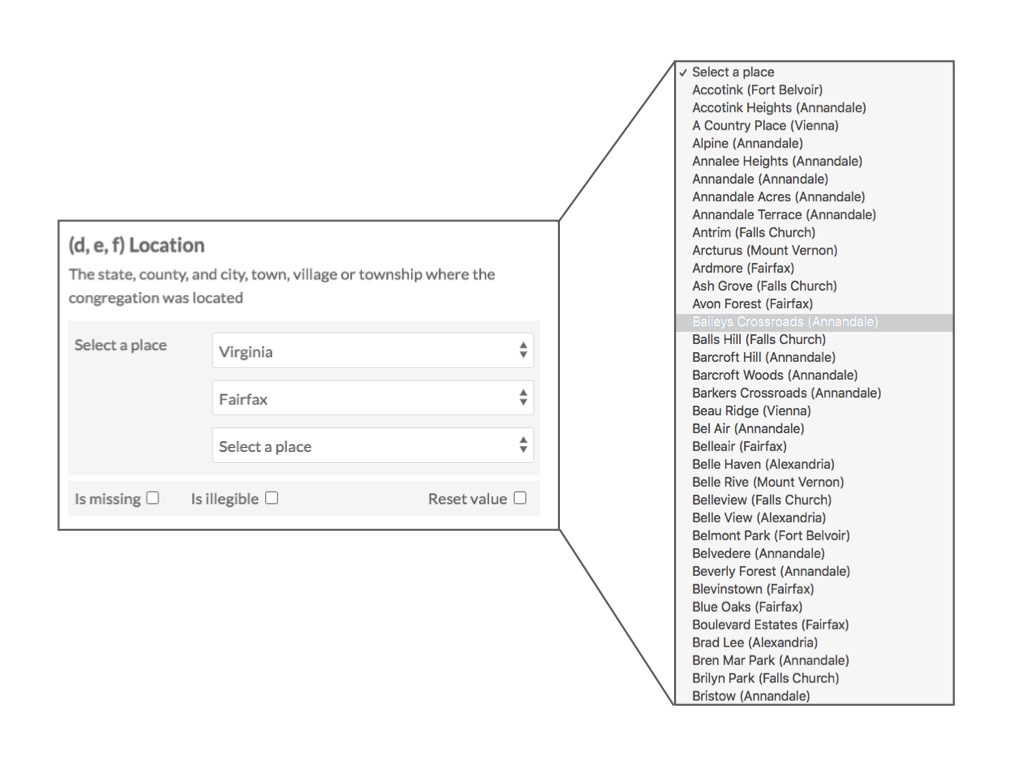
Figure 4. An image of the populated place dropdown box used for transcription in Datascribe.
DataScribe’s interface allows for collaboration and management of the transcription process.
DataScribe helps teams of transcribers and reviewers collaborate on the transcription process, and lets project managers keep track of the progress. For our project, transcribers see a schedule side-by-side with our transcription form. They can also see items that are assigned to them, have the ability to flag items with fields that seem out of the ordinary, or leave comments for the reviewers. Reviews can then see submitted transcriptions along with their flags and comments, and decide to respond to them or simply update the transcription. Finally, DataScribe lets managers assign items to particular transcribers or reviews, and keep track of the status of the transcriptions. All of these features have allowed the large American Religious Ecologies project team to collaborate on and communicate about the transcription process asynchronously, directly in the DataScribe interface.
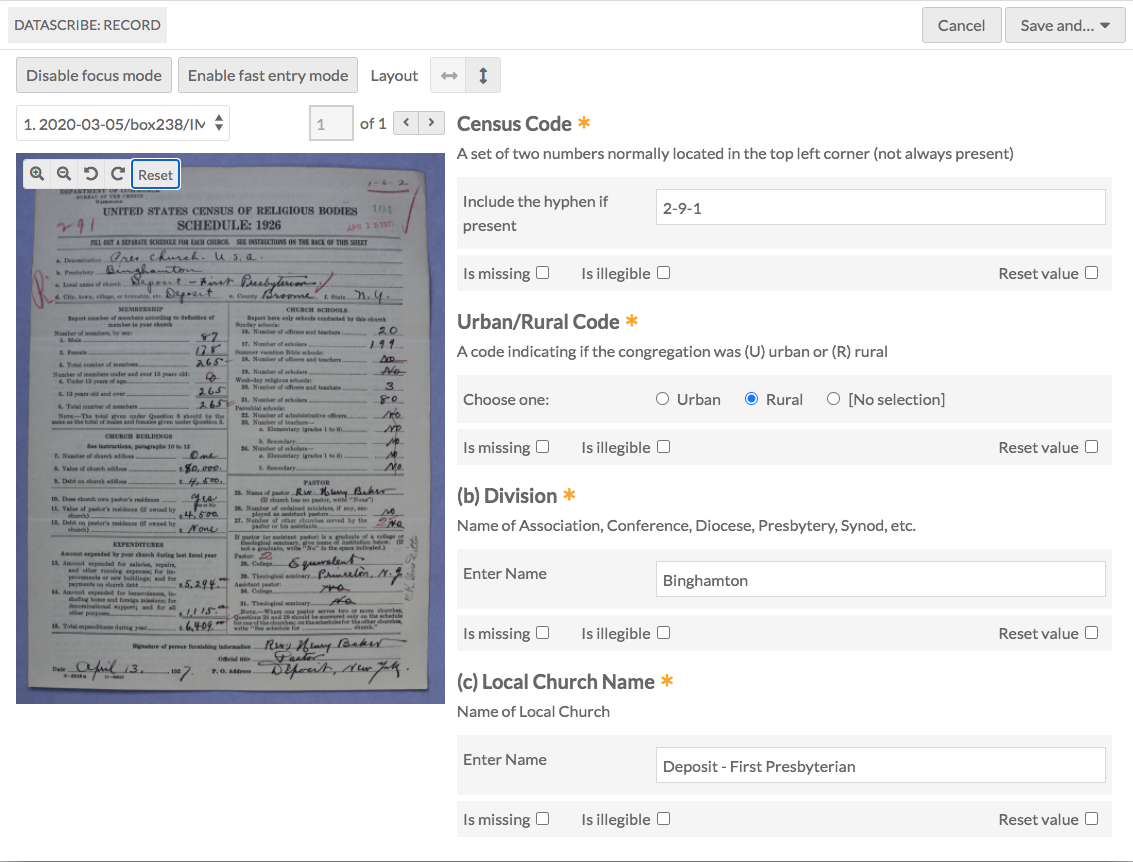
Figure 5. The DataScribe transcription interface is where transcribers do most of their work.
DataScribe, built in Omeka S, fits seamlessly with our existing online system.
Our website for the 1926 Census of Religious Bodies, where users can already freely browse 40,000+ digitized documents, was built using the content management system Omeka S. Since DataScribe is built on the same platform, we can easily synchronize data across modules. Eventually the datasets we have created using DataScribe will also be freely available on our website.
As is evident from the points above, DataScribe has already and will continue to be a critical part of the American Religious Ecologies project’s efforts to increase the structure, accuracy, and usability of the datasets this project is creating for the study of American religion.