How middle was Middletown?
In a previous blog post we undertook an examination of the city-level data provided by the 1926 Census of Religious Bodies. The membership data for cities, I argued, lets us get a broad sense of the degree of religious diversity in U.S. cities.
Following on from that post, I want to look at one city in particular. Which city should we pick? For today, let’s use Muncie, Indiana. Why Muncie? Muncie was famously labeled as “Middletown” by the sociologists Robert Staughton Lynd and Helen Merrell Lynd. They published their book Middletown: A Study in Modern American Culture in 1929. That work was thus almost exactly contemporaneous with the 1926 Census of Religious Bodies, whose tabulation was completed in 1928. Since then, Muncie has been the site of literally hundreds of studies, many of them about religion.1 The choice of a small to mid-sized city like Muncie was, of course, a deliberate claim about typicality over againts major cities like New York and Chicago and Los Angeles.
One of the interesting avenues of research that the Census of Religious Bodies enables is studying cities (and for that matter, rural places) extensively rather than intensively. In other words, the sheer amount of scholarship brought to bear on Muncie or New York will never be equaled for other U.S. cities. But by using the census data, we can try to test in a quantitative way how much a given city deviated from measures of central tendency. In other words, we can ask, how middle was Middletown? And for that matter, we can ask how typical or exceptional was any other American city that the Census Bureau counted.
Below are a series of visualizations of the 1926 city-level data about religious membership, in each case highlighting Muncie. For now these visualizations are decidedly exploratory rather than argumentative. But they illustrate how we can understand one city’s religious ecology in relation to other cities.
We can start just by asking which religious groups in Muncie had the most members—or at least, the most members counted by the Census Bureau. (Click on each figure to see a larger image if necessary.)
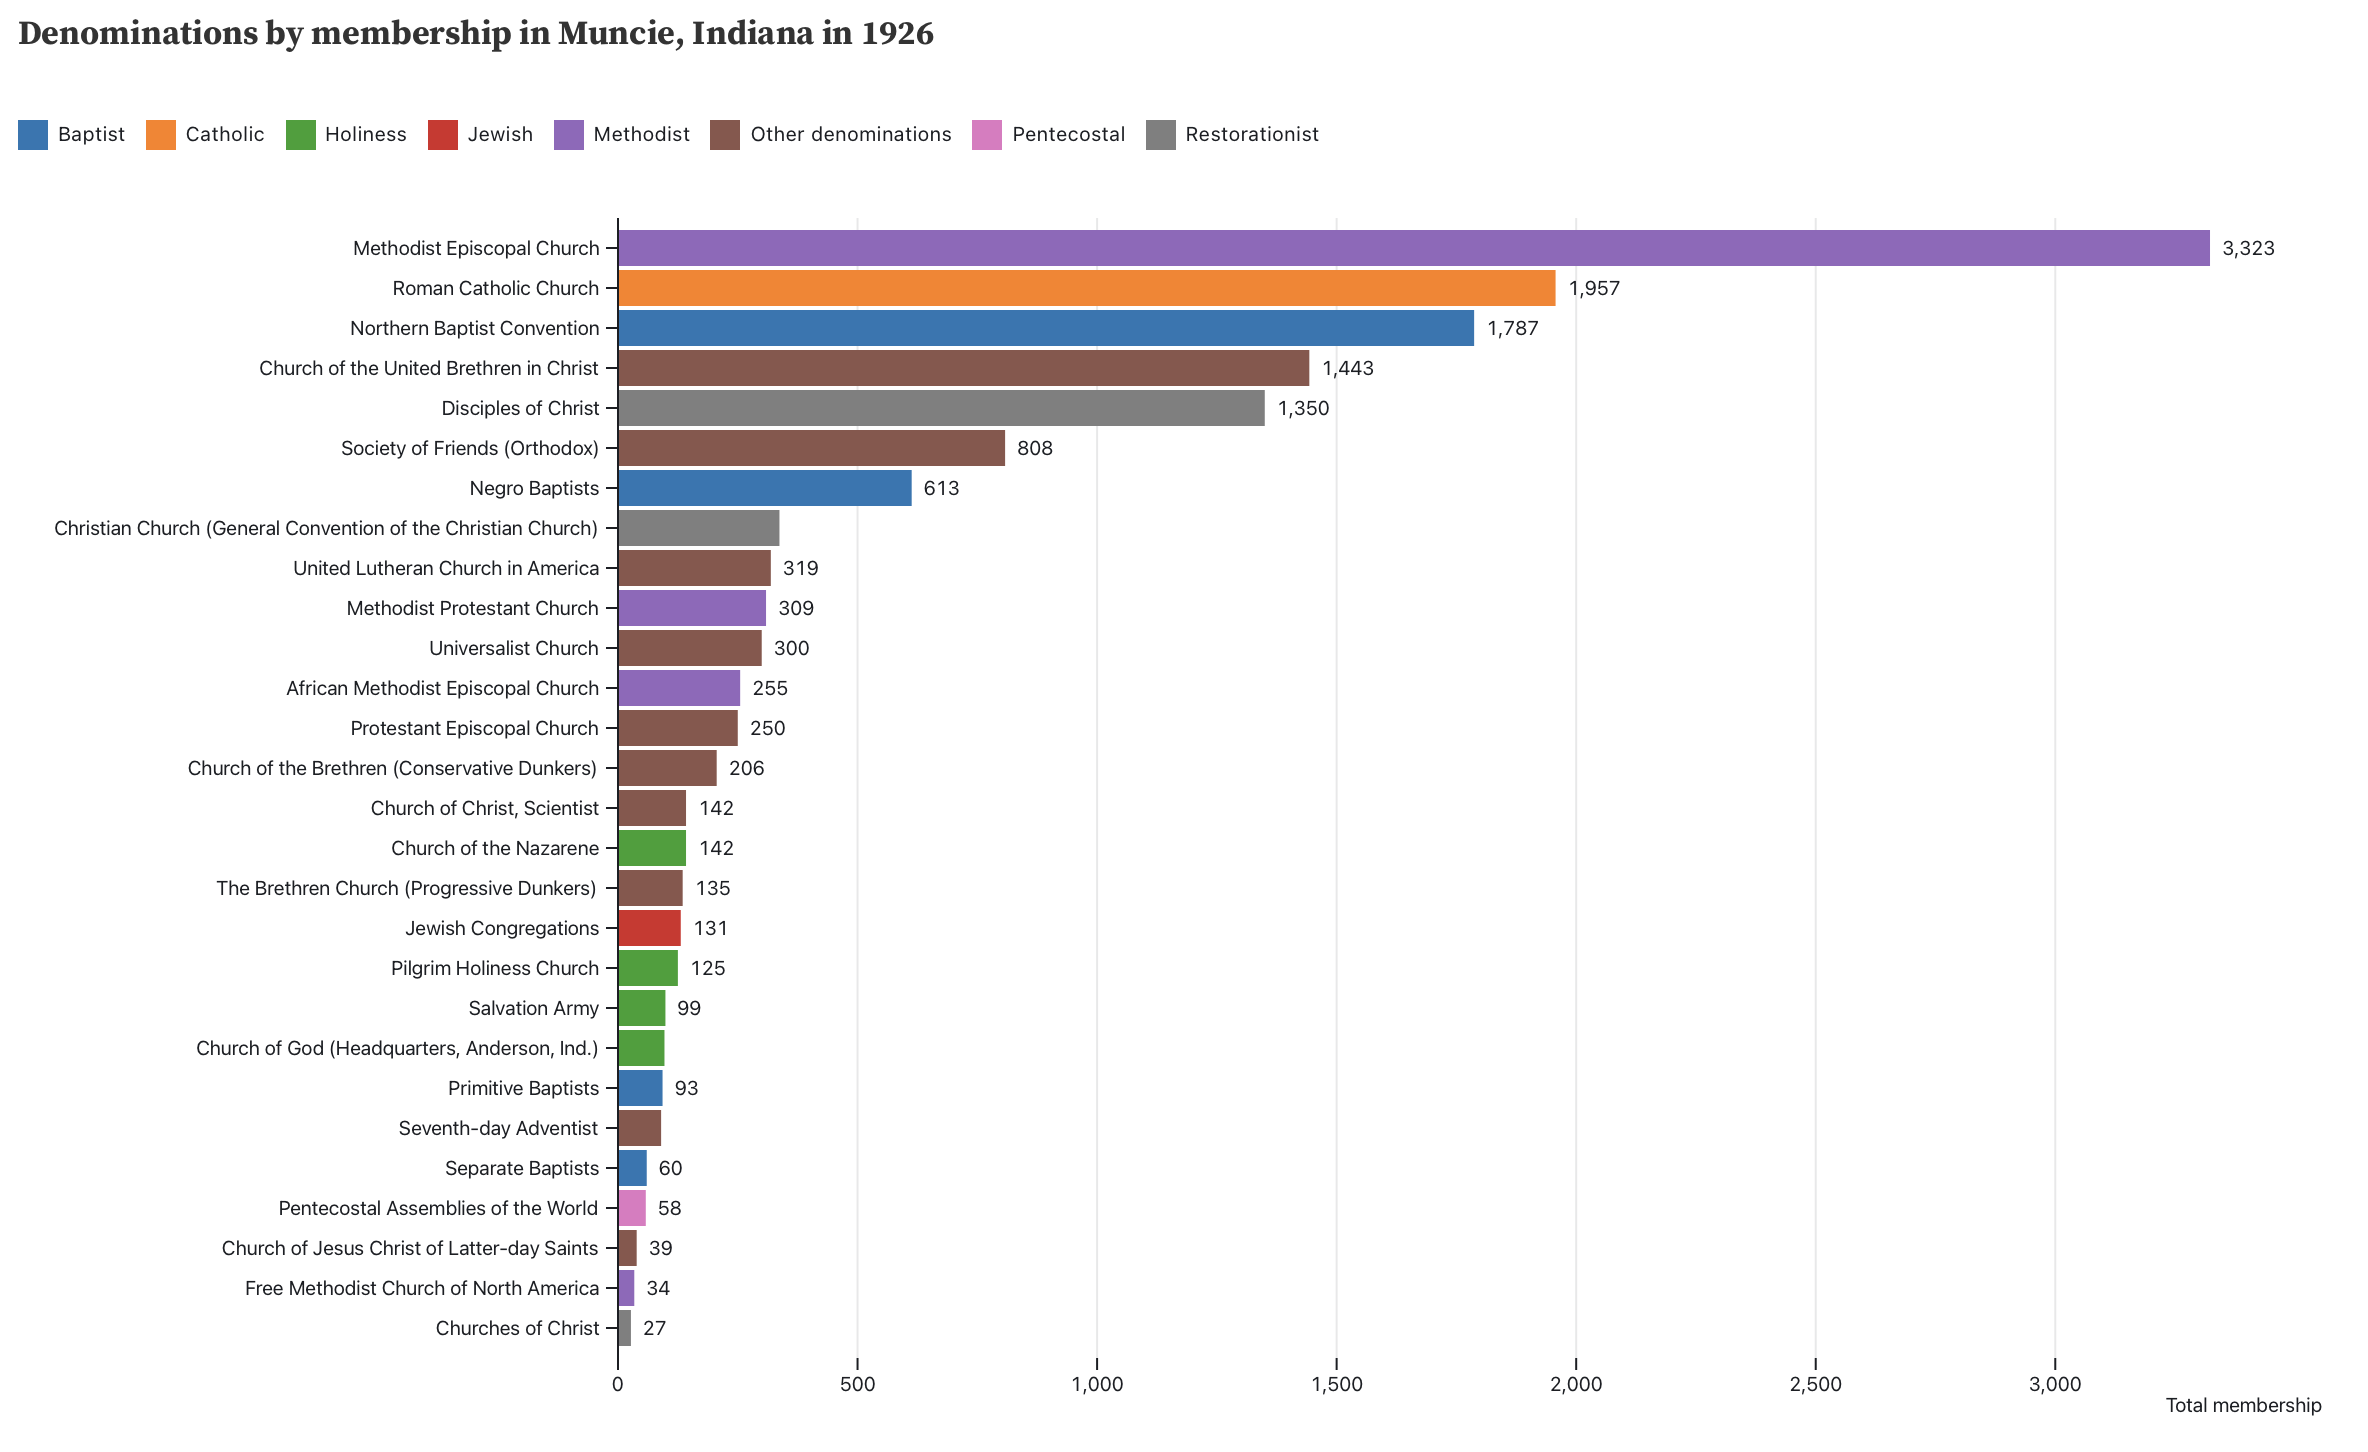
Denominations in Muncie ranked by the number of reported members.
Unsurprisingly, Methodists, Roman Catholics, and Baptists were the top three denominations. (I should write, “perhaps unsurprisingly.” What we are trying to do is measure what is surprising and not rather than rely solely on our intuition or prior knowledge.) Also unsuprising is that the Baptists and Methodists had multiple different denominations. (As John Turner has written about, in the case of black Baptists the way the counting was done reflected the particular racial assumptions of the Census Bureau.) But we are also able to see the relative prominence of Holiness, Pentecostal, and Restorationist traditions as well.
If that is what Muncie’s religious ecology looks like, how does it compare to other cities? We can assume that the larger a city is, the more kinds of religion it is likely to have, because the more people a city has, the more kinds of people it is likely to have. So we can check whether Muncie’s religious diversity is typical or exceptional for its size. As a crude metric, we can use the number of different denominations (though perhaps in future analysis it might be better to count all Methodist denominations as a part of a Methodist family, or use some other kind of grouping other than the census’s category of “denomination.”) We can find that Muncie had slightly more denominations than would be expected for a city of its size.
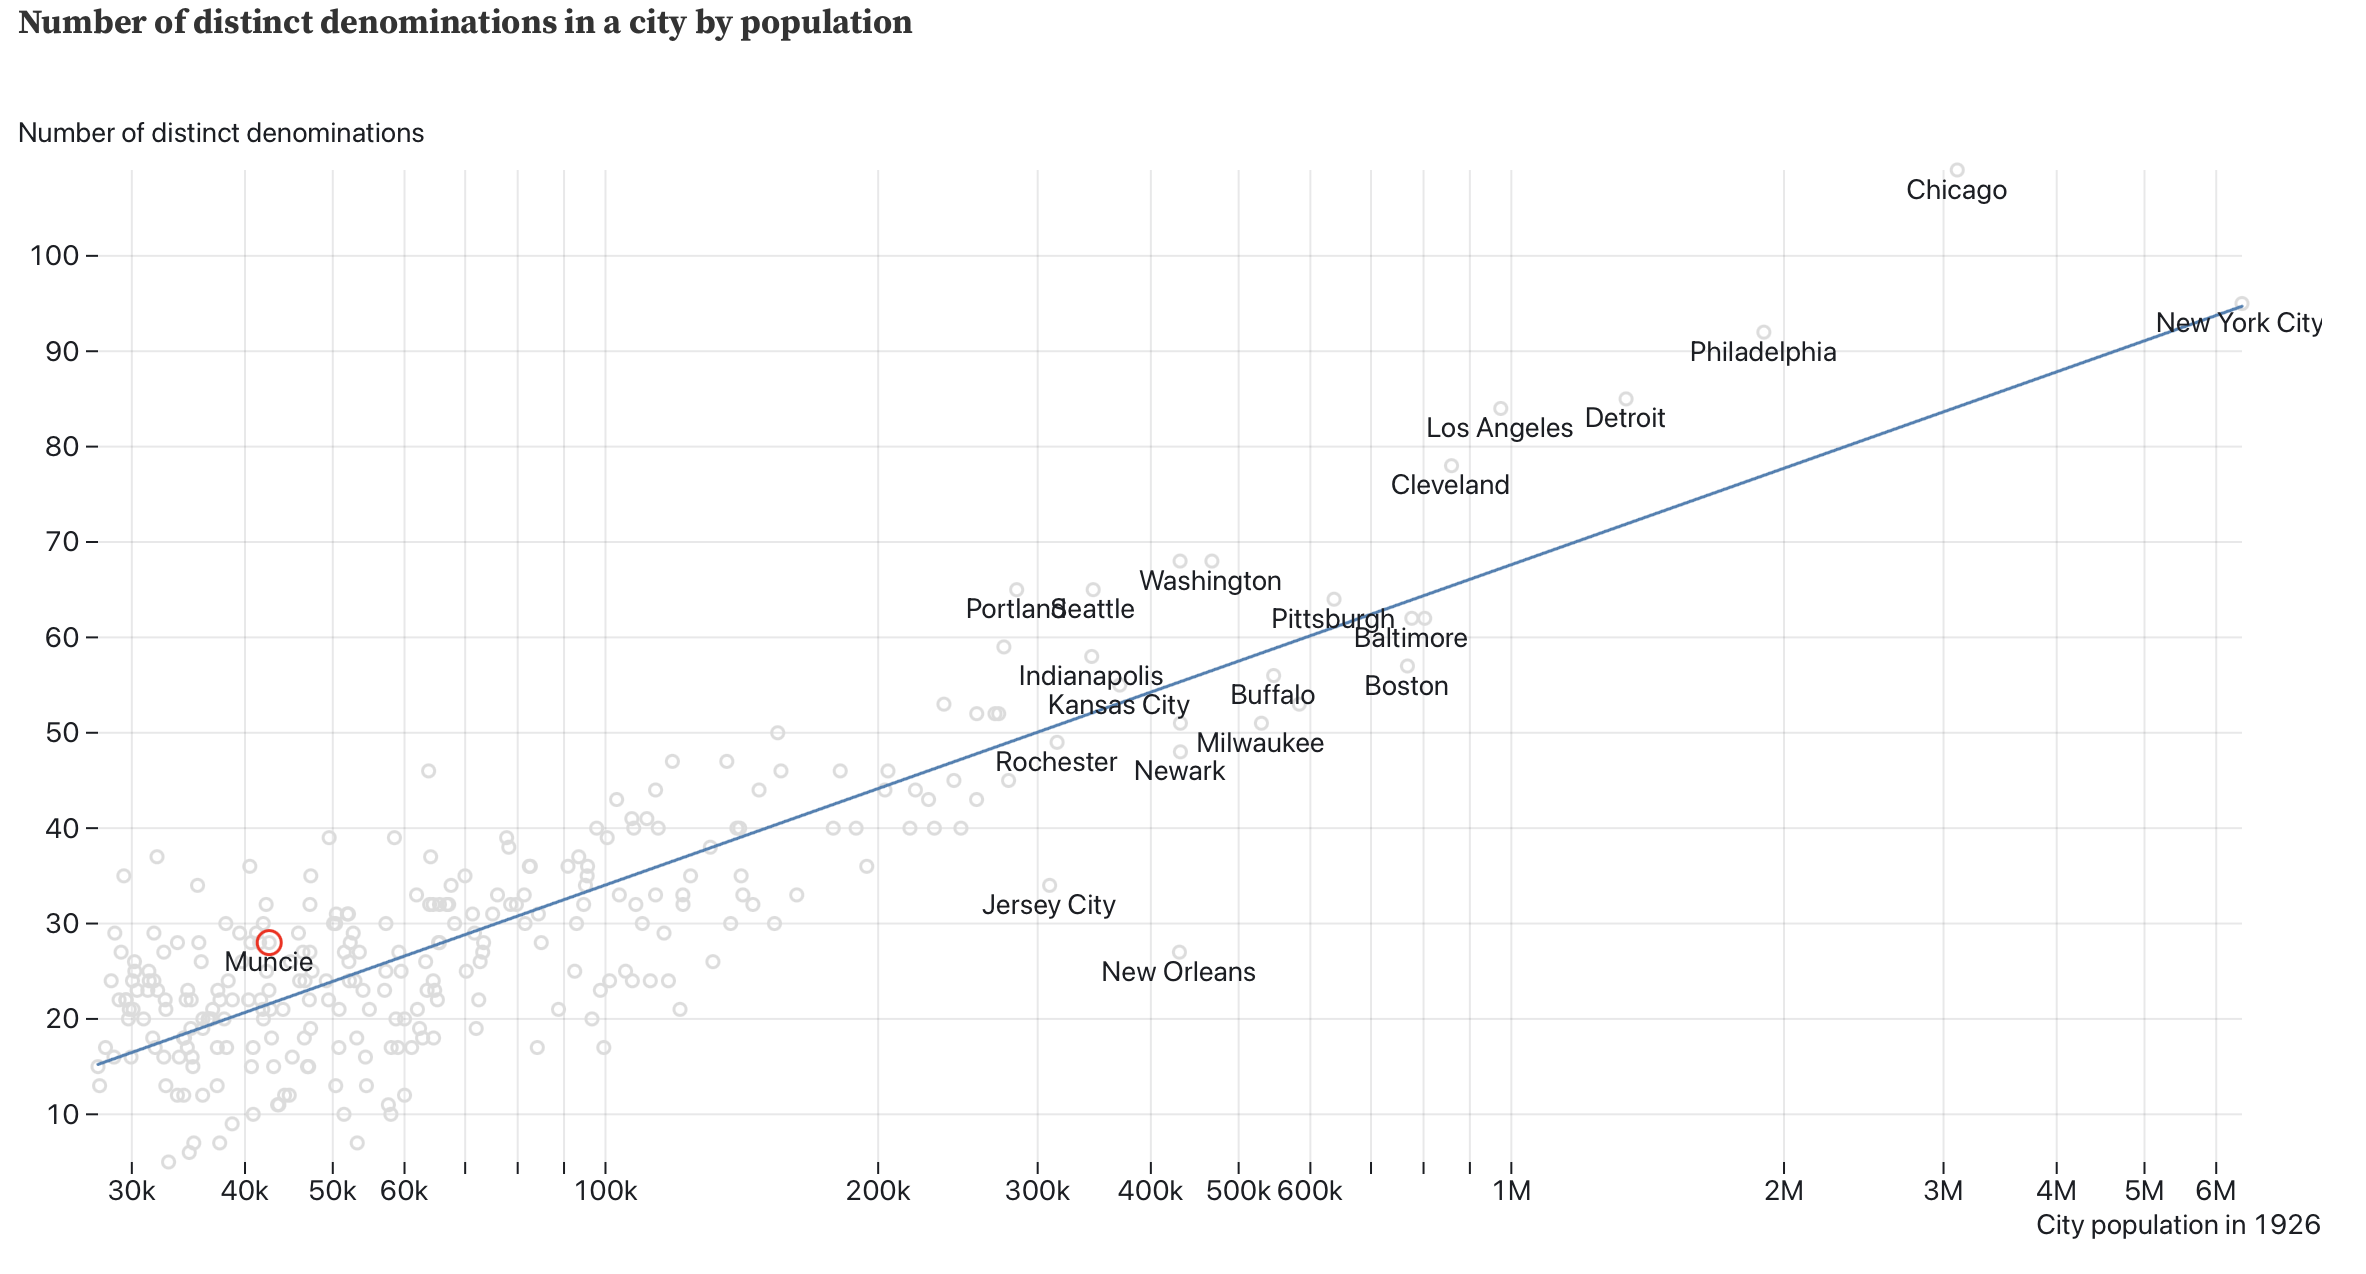
Muncie had a slightly higher number of denominations than would be expected for a city of its size.
Another angle of comparison is what percentage of the city was counted by the Census Bureau as belonging to a religious denomination. Of course, the percentage of religious membership is likely to be more or less accurate based on a number of factors, and does not perfectly measure the difficult to define category of religious affiliation. The Census Bureau may have done a better or worse job in counting a particular place, and as we have written about a number of times, not every religious group counted for the Census Bureau. There is also the difficulty of estimating the population in 1926, given that the best estimates for population we have come from the 1920 and 1930 census. Still, we can place Muncie in that context.

A smaller than expected proportion of the population of Muncie was counted as belong to the religious denominations that the Census Bureau enumerated.
We can also think about Muncie’s different religious groups in relation to other cities. For example, Methodists were the most numerous religious group in Muncie. We can estimate the proportion of Methodists among the total number of members of religious groups enumerated in Muncie. Was that proportion greater or lower than for other cities? We can d that for various religious groups in Muncie.
Muncie had a higher than expected proportion of Methodists.
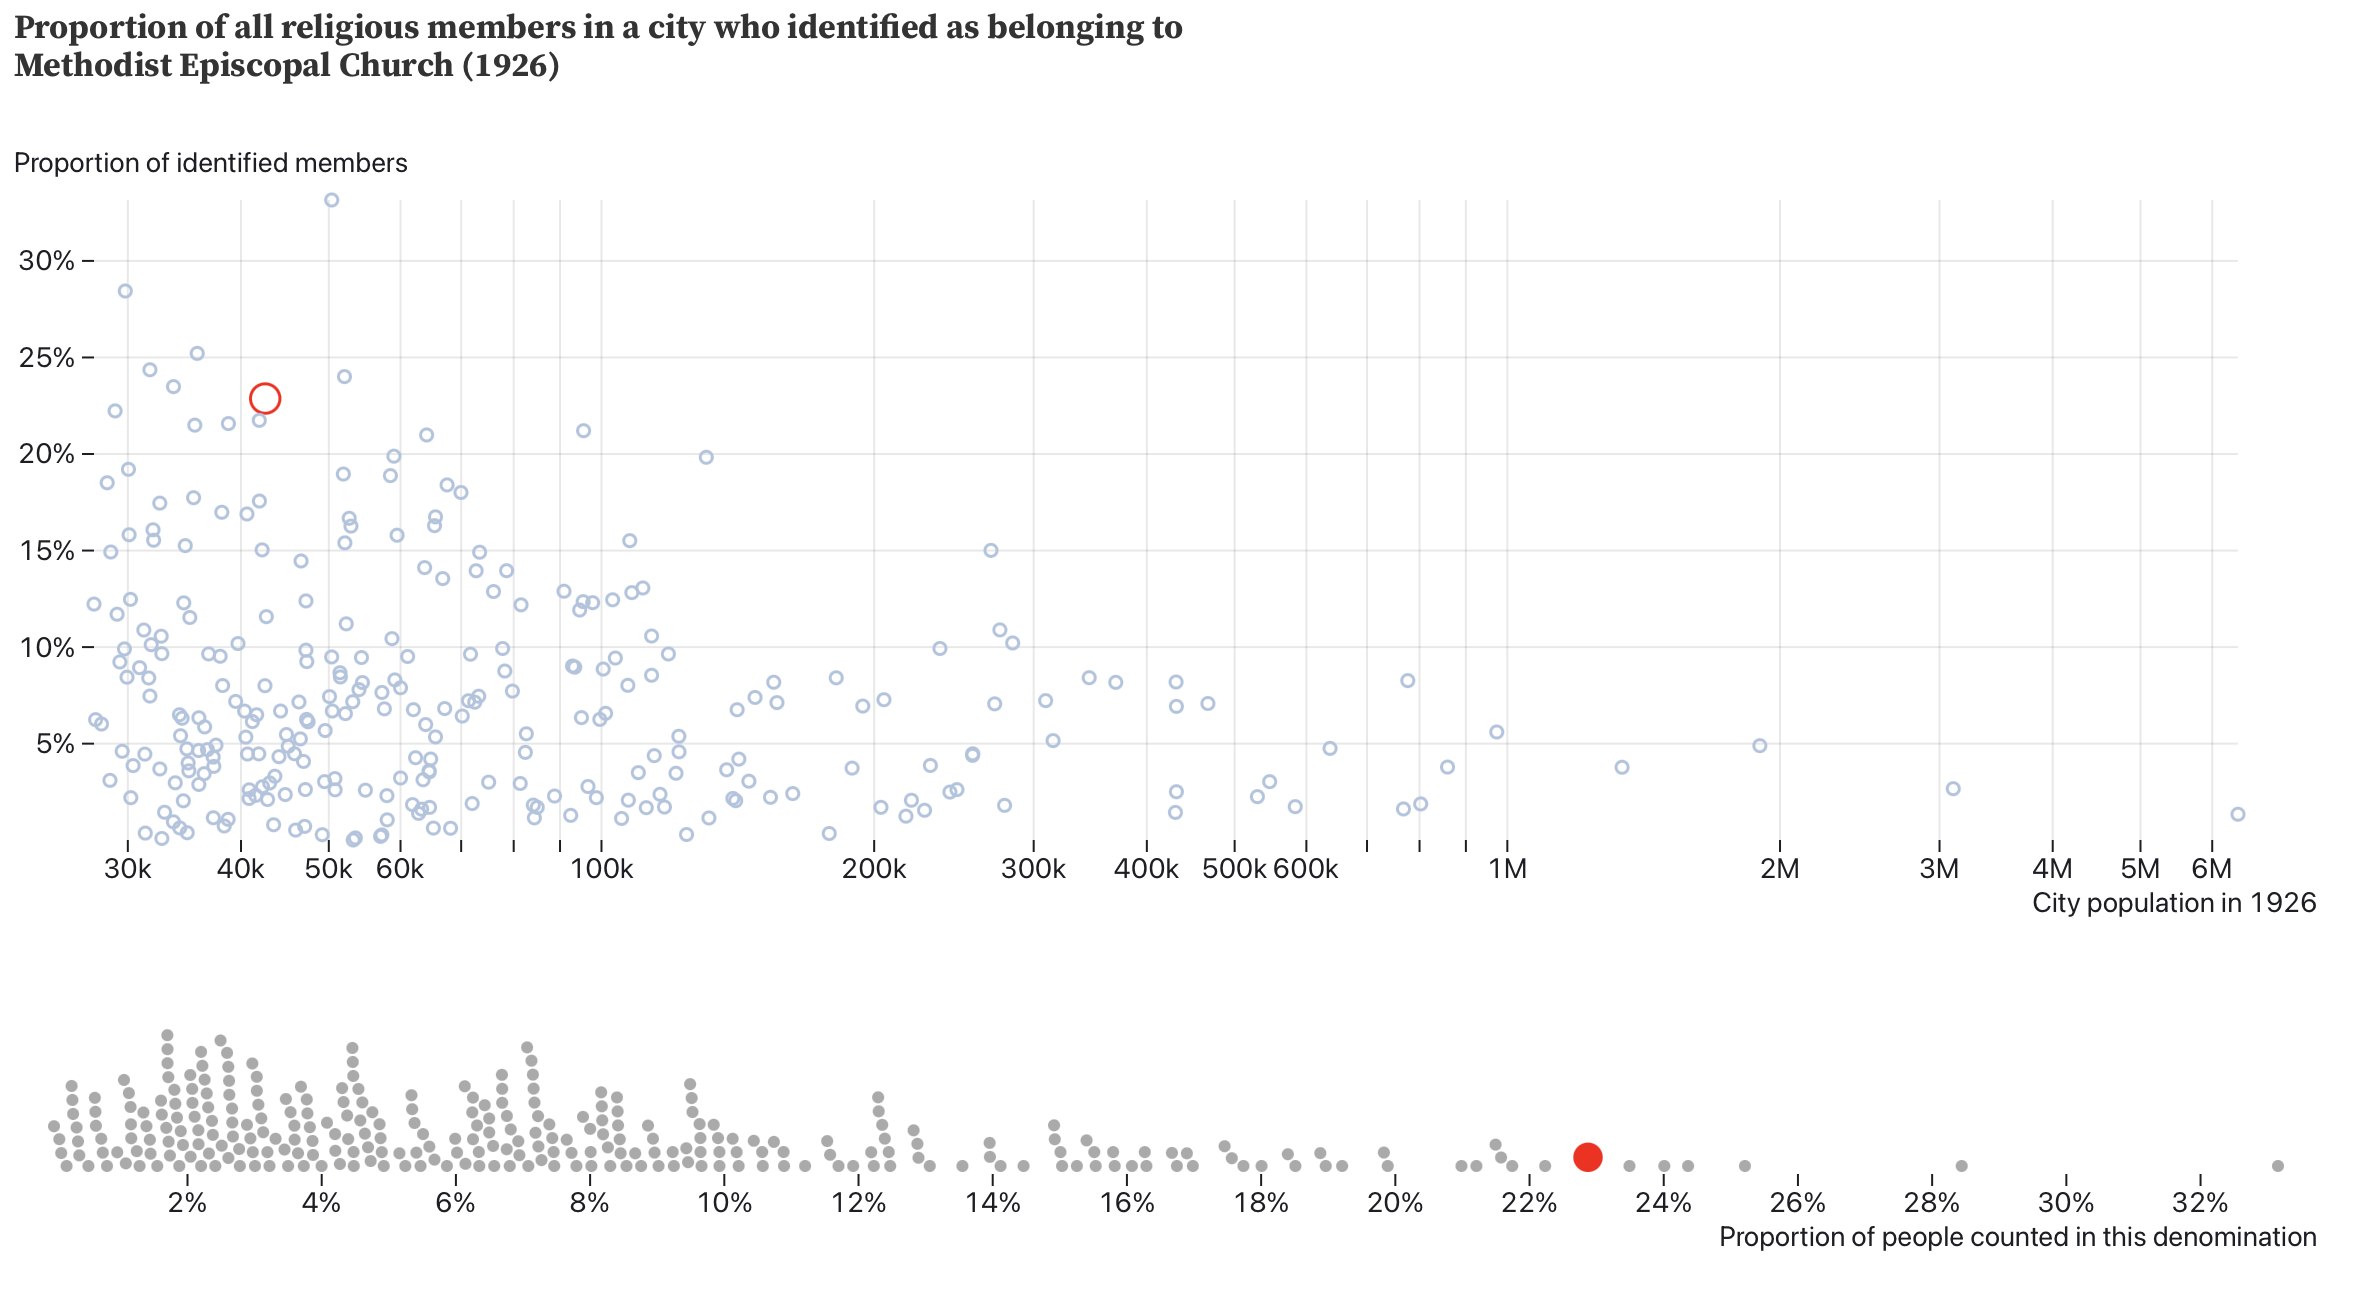
The proportion of Methodist Episcopal Church members in Muncie in 1926.
Muncie had a higher than expected proportion of Christian Scientists.
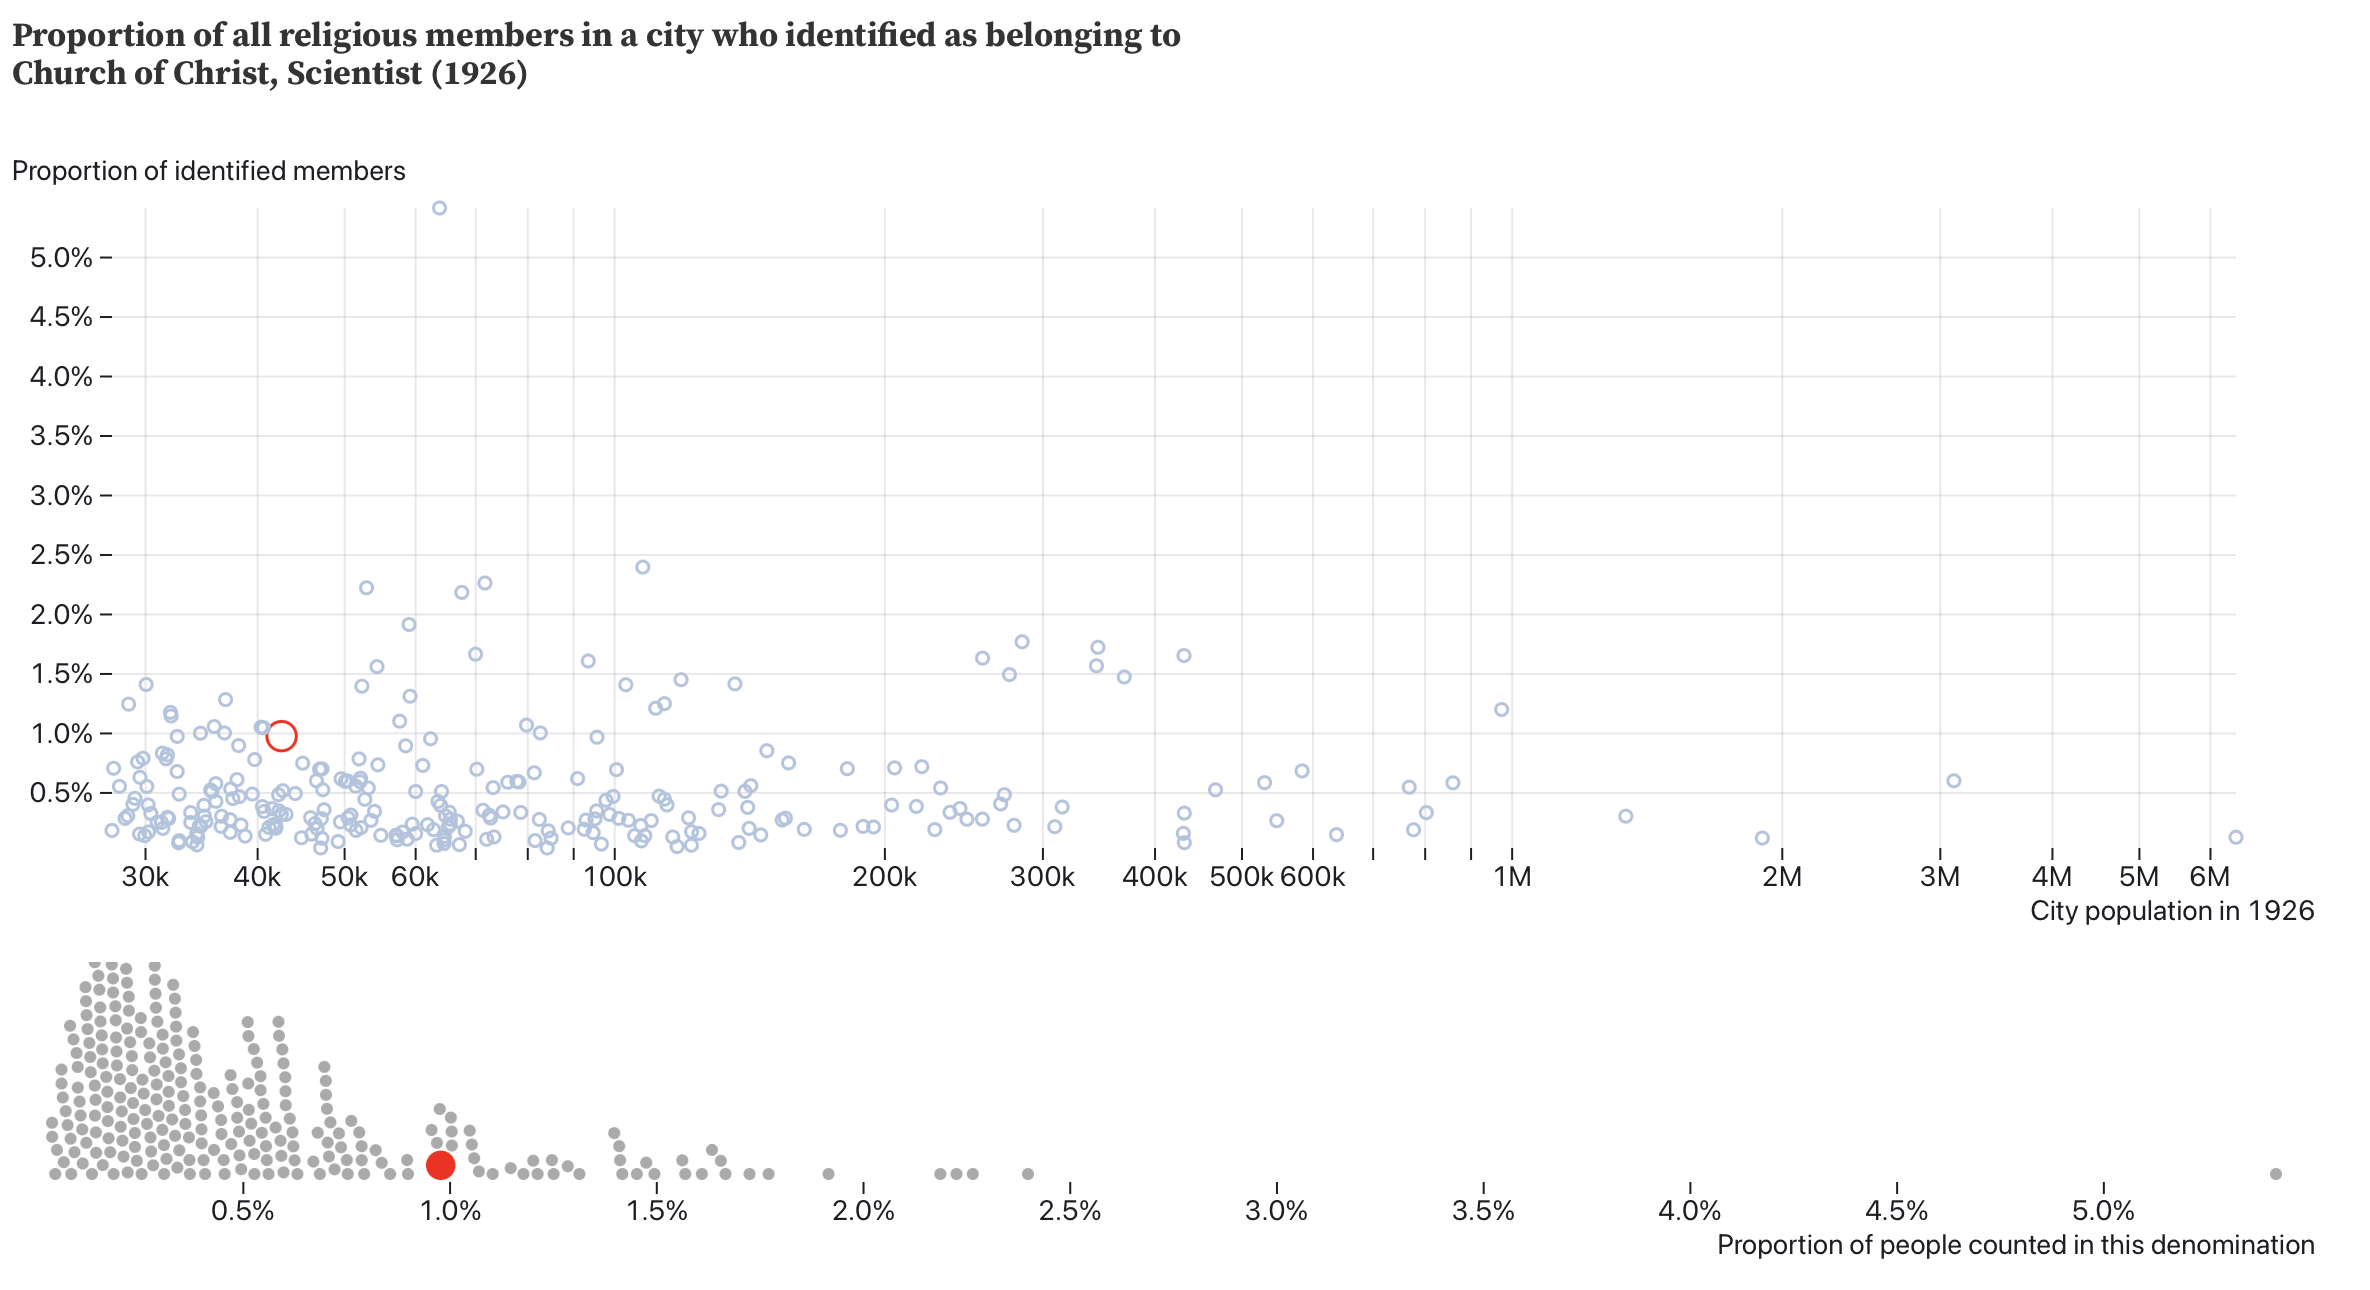
The proportion of Christian Scientists in Muncie in 1926.
Muncie had a lower than expected proportion of Episcopalians.

The proportion of Episcopalians in Muncie in 1926.
It had more Quakers than expected.

The proportion of Friends in Muncie in 1926.
But it had fewer Jews.
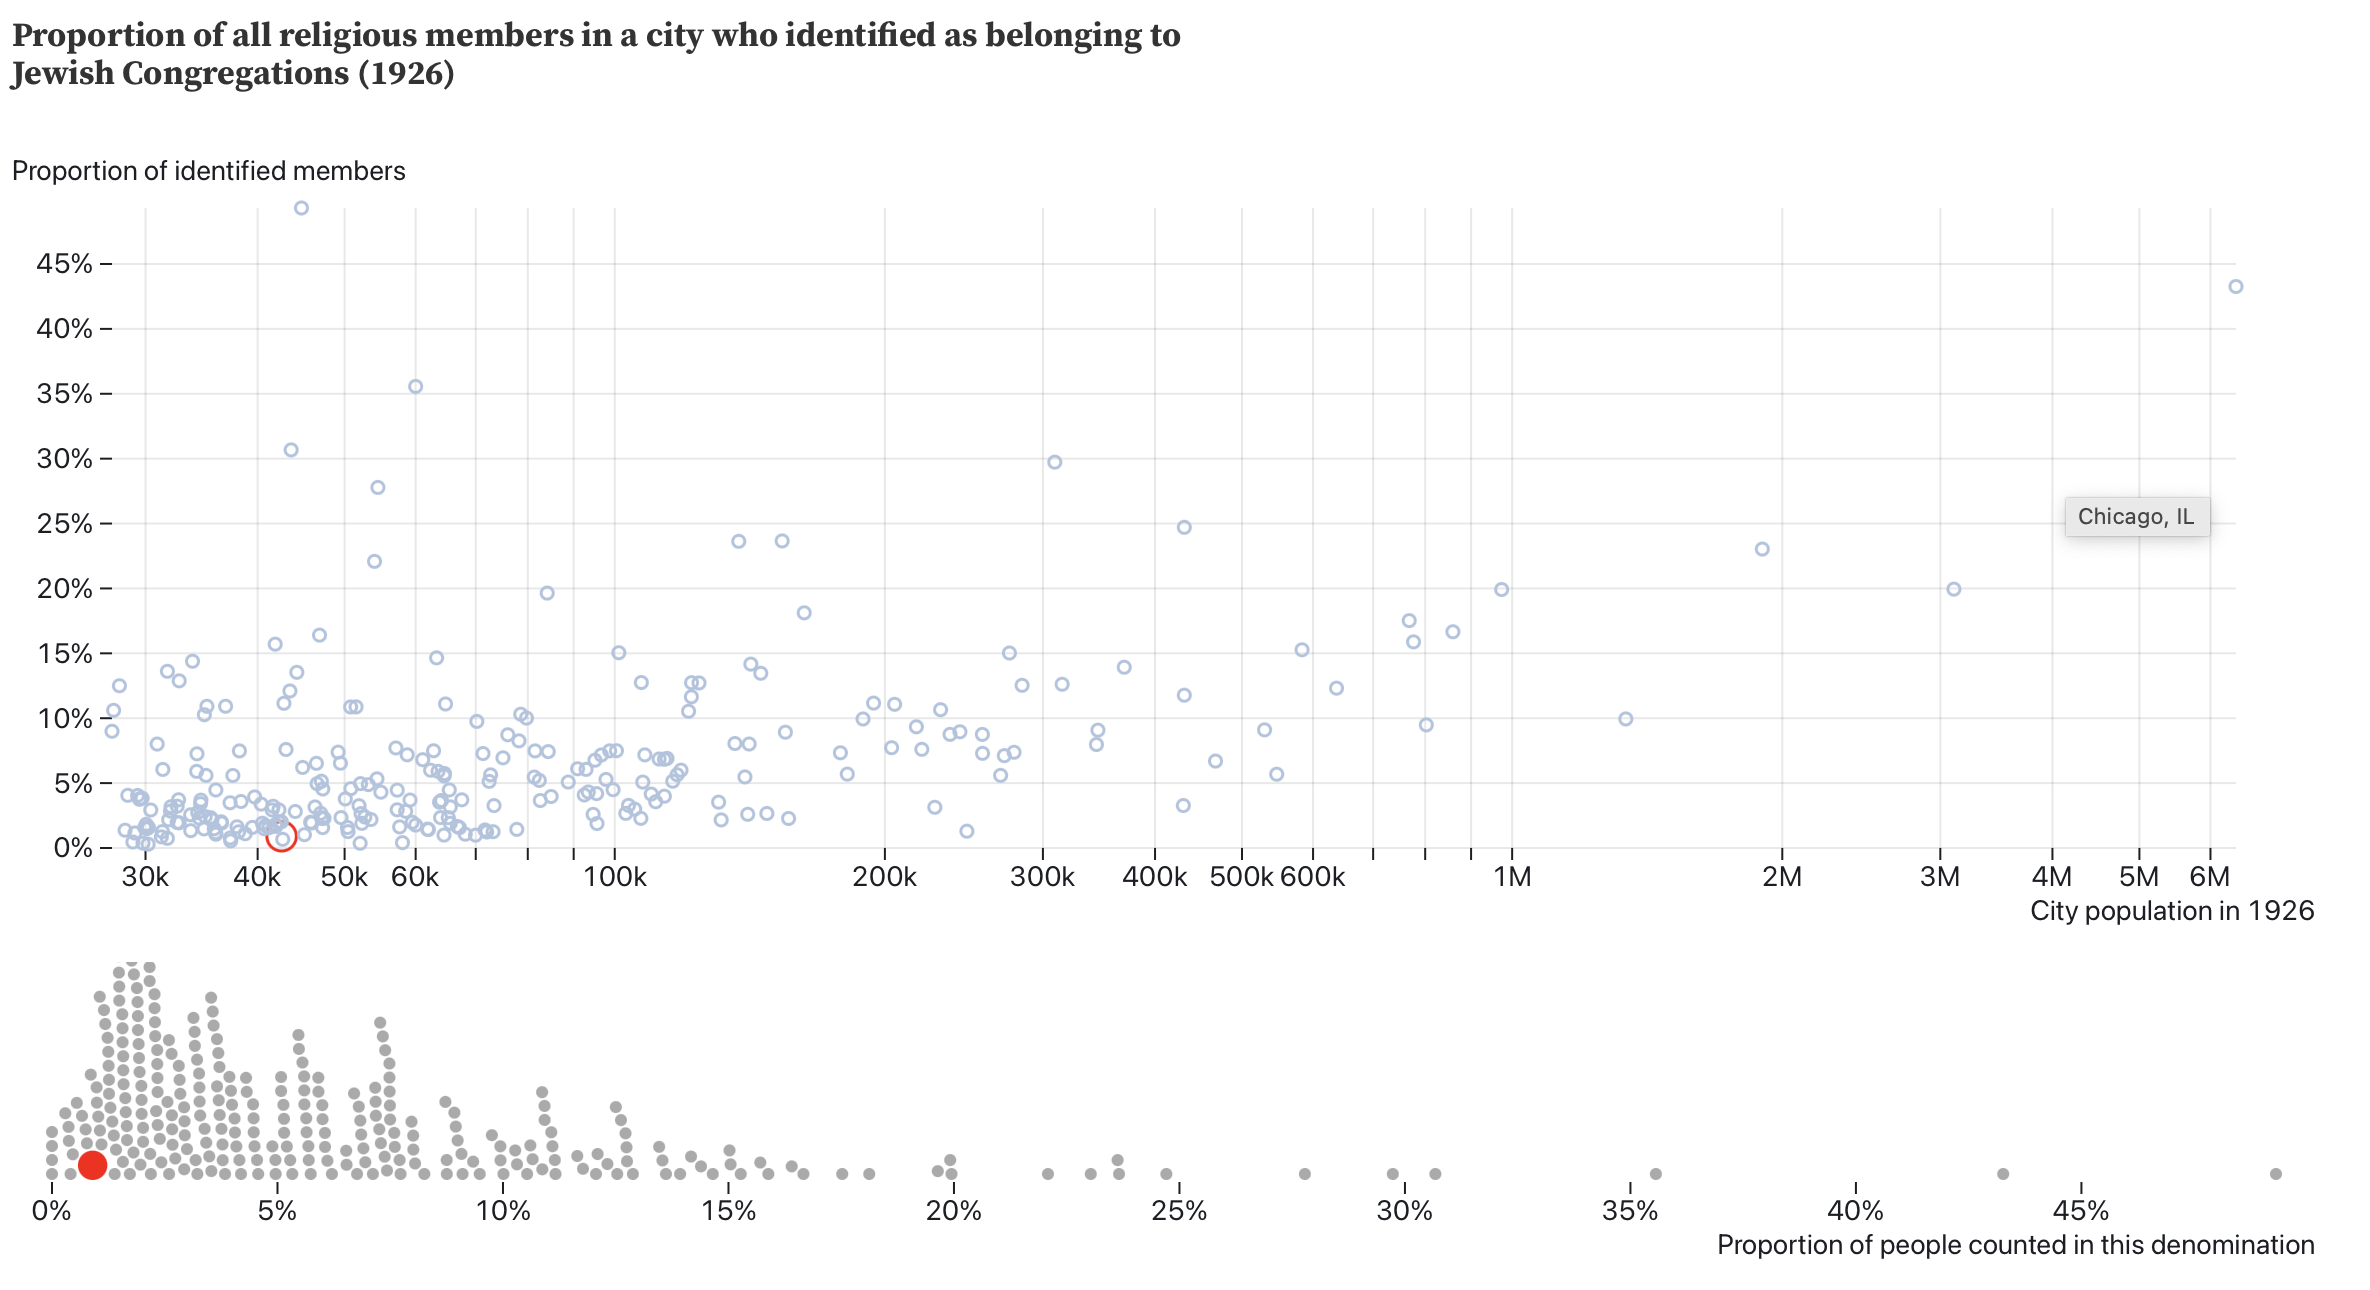
The proportion of Jews who were members of congregations in Muncie in 1926.
It had more Northern Baptists.
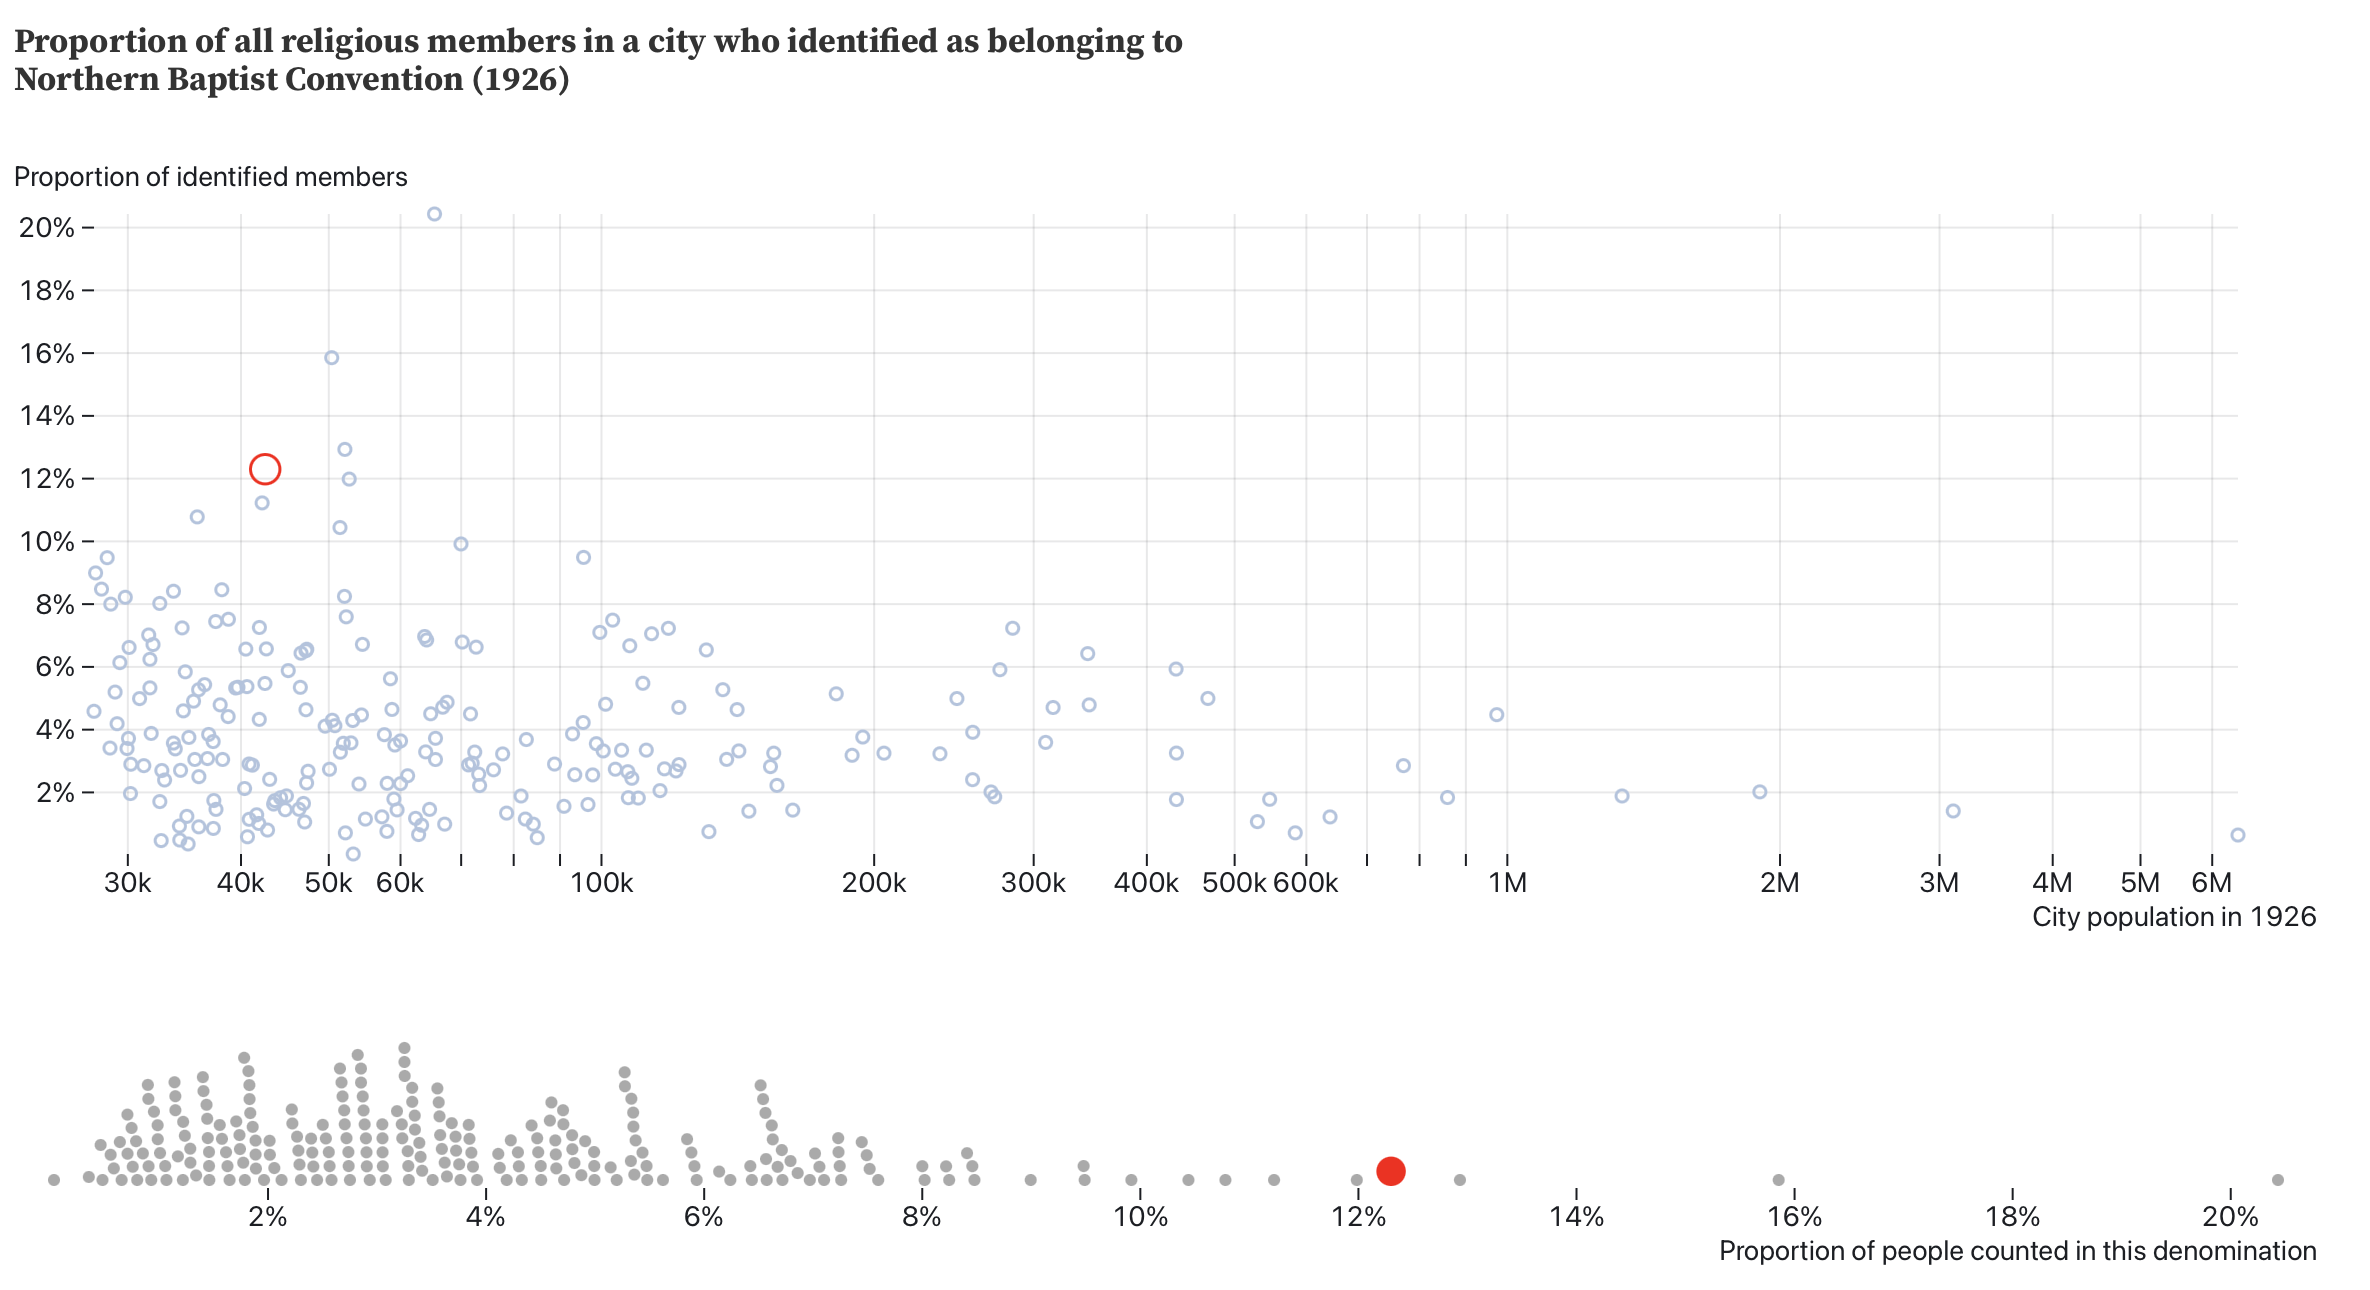
The proportion of Northern Baptists in Muncie in 1926.
And somewhat more Pentecostals.
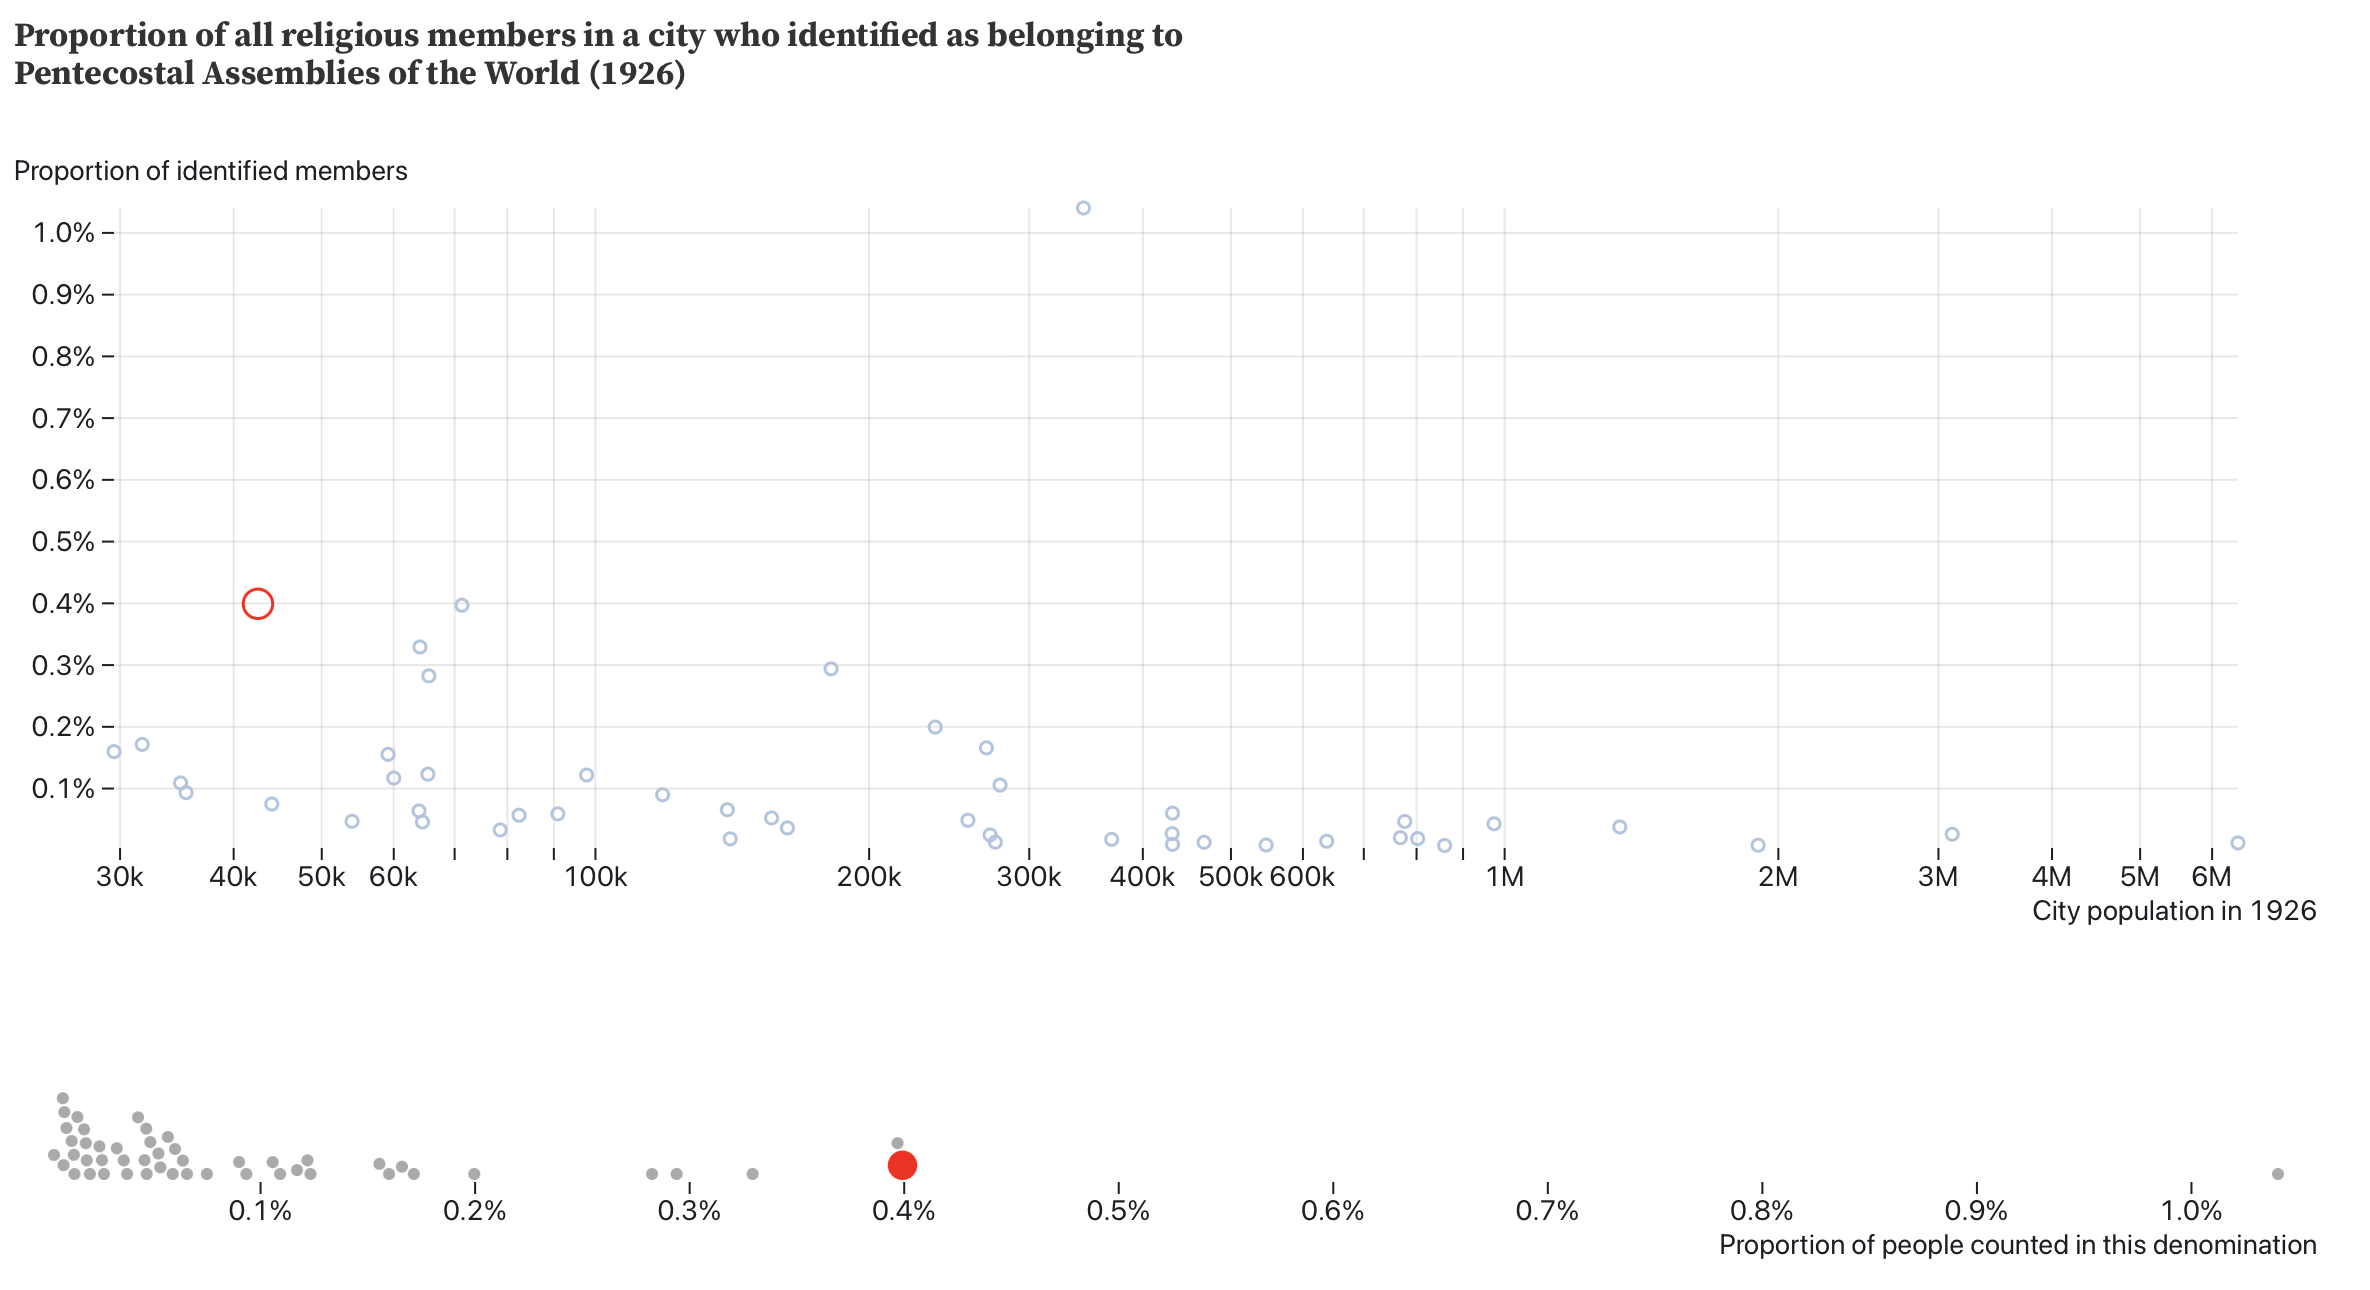
The proportion of Pentecostal Assemblies in Muncie in 1926.
It had more members of the Salvation Army.
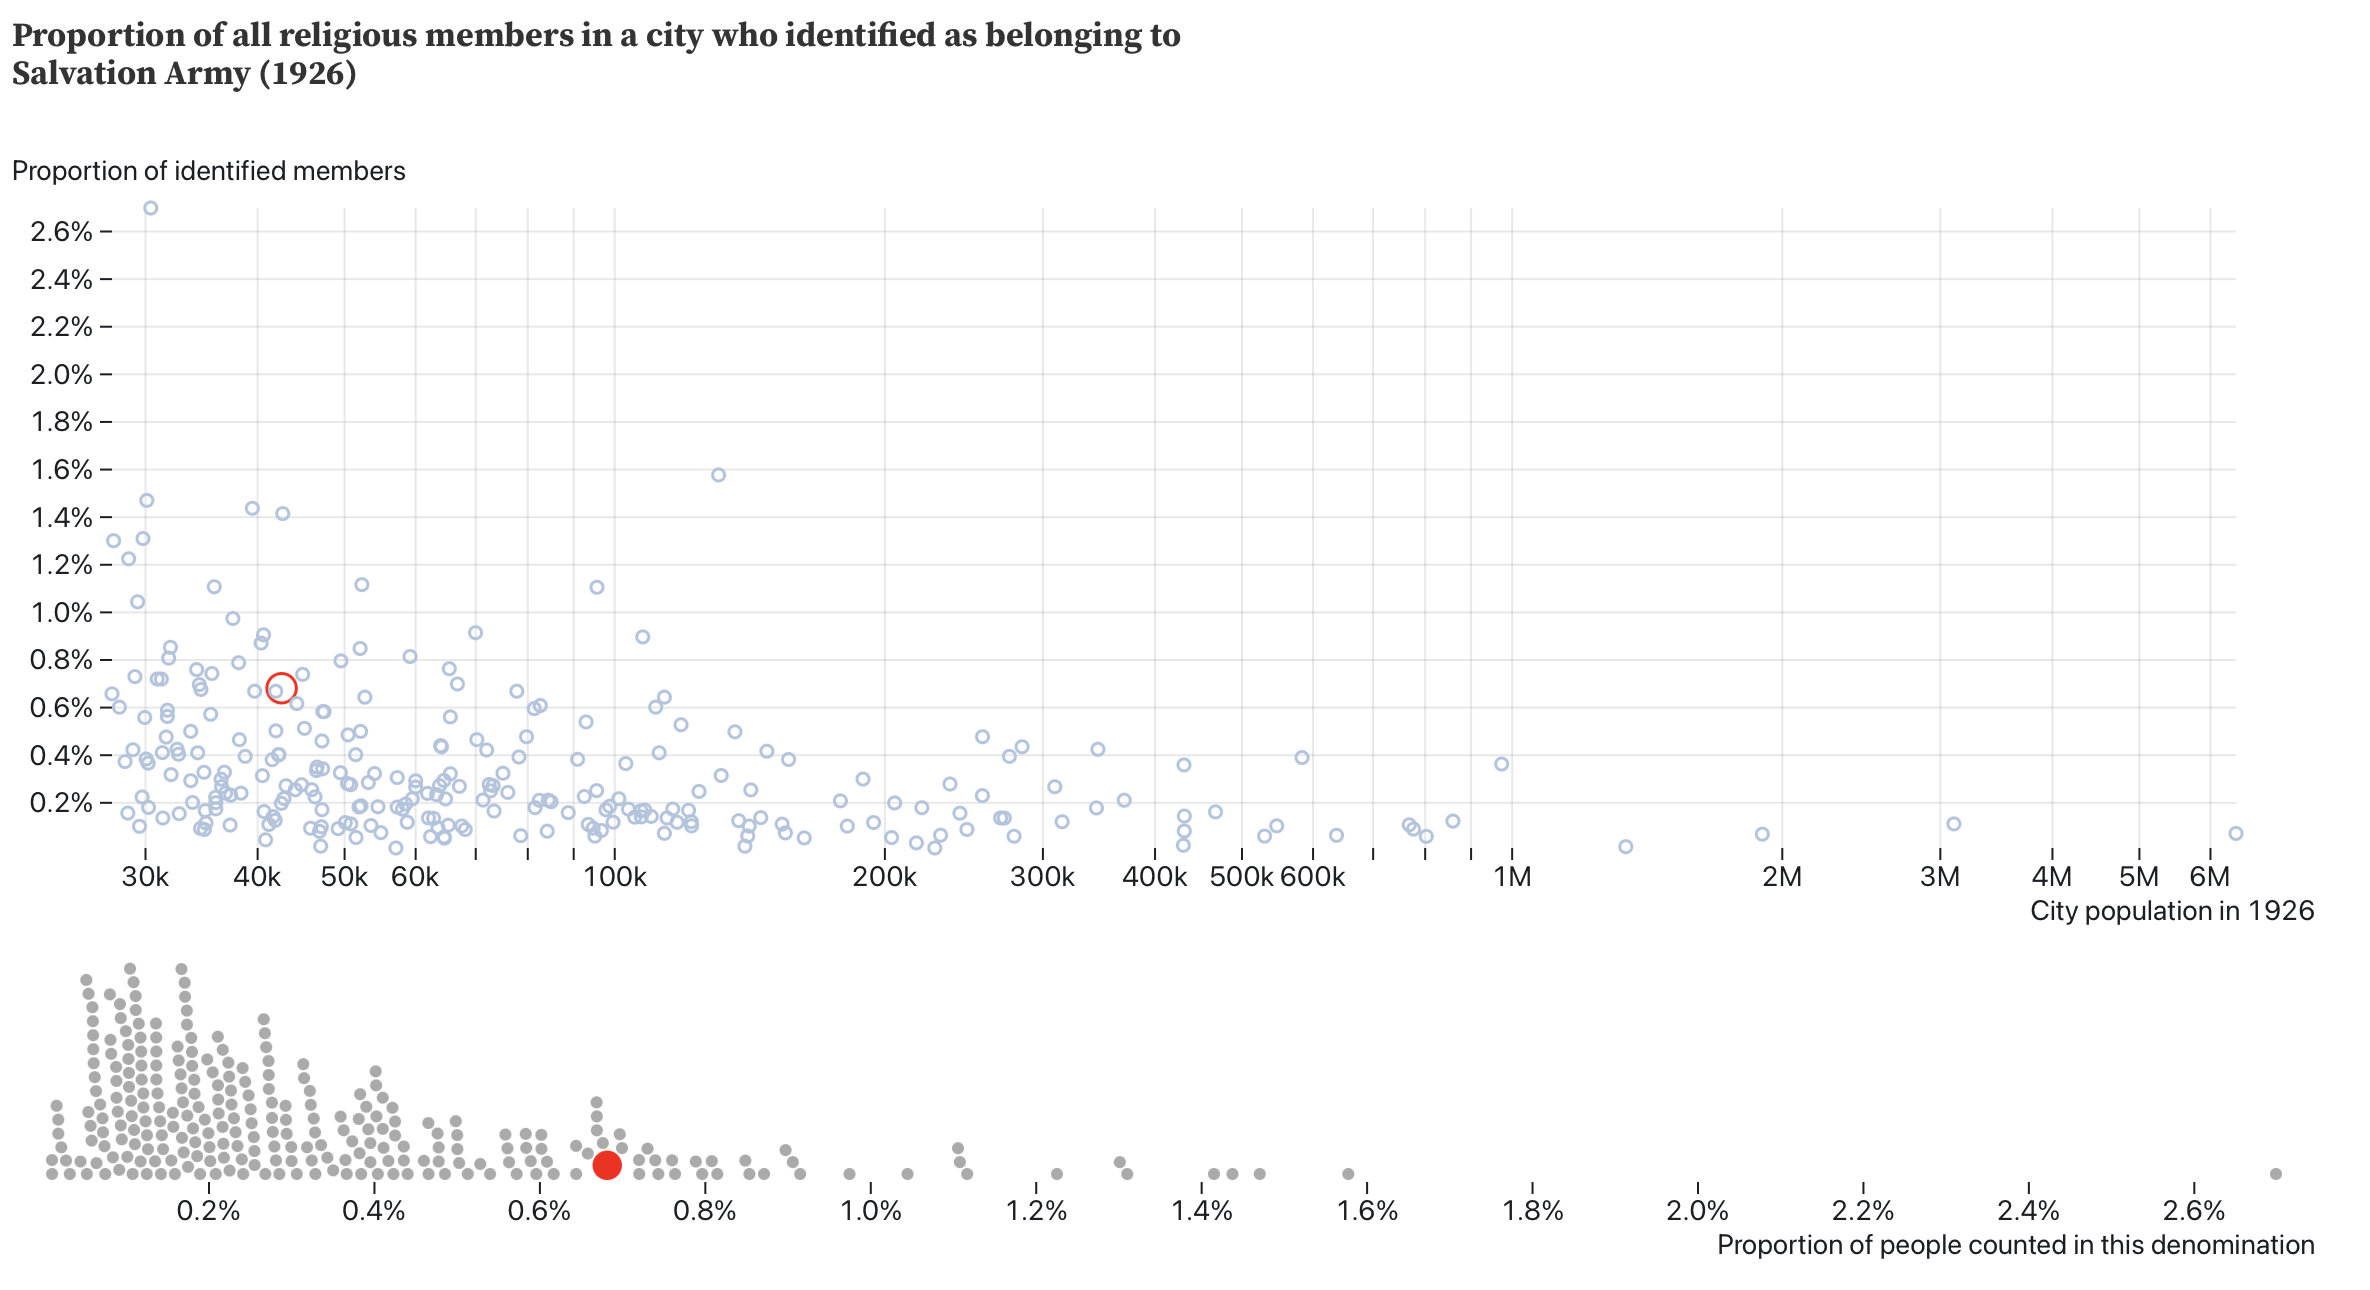
The proportion of Salvation Army members in Muncie in 1926.
But—despite the fact that Roman Catholics were the second biggest denomination in the city—it had fewer than expected Catholics.
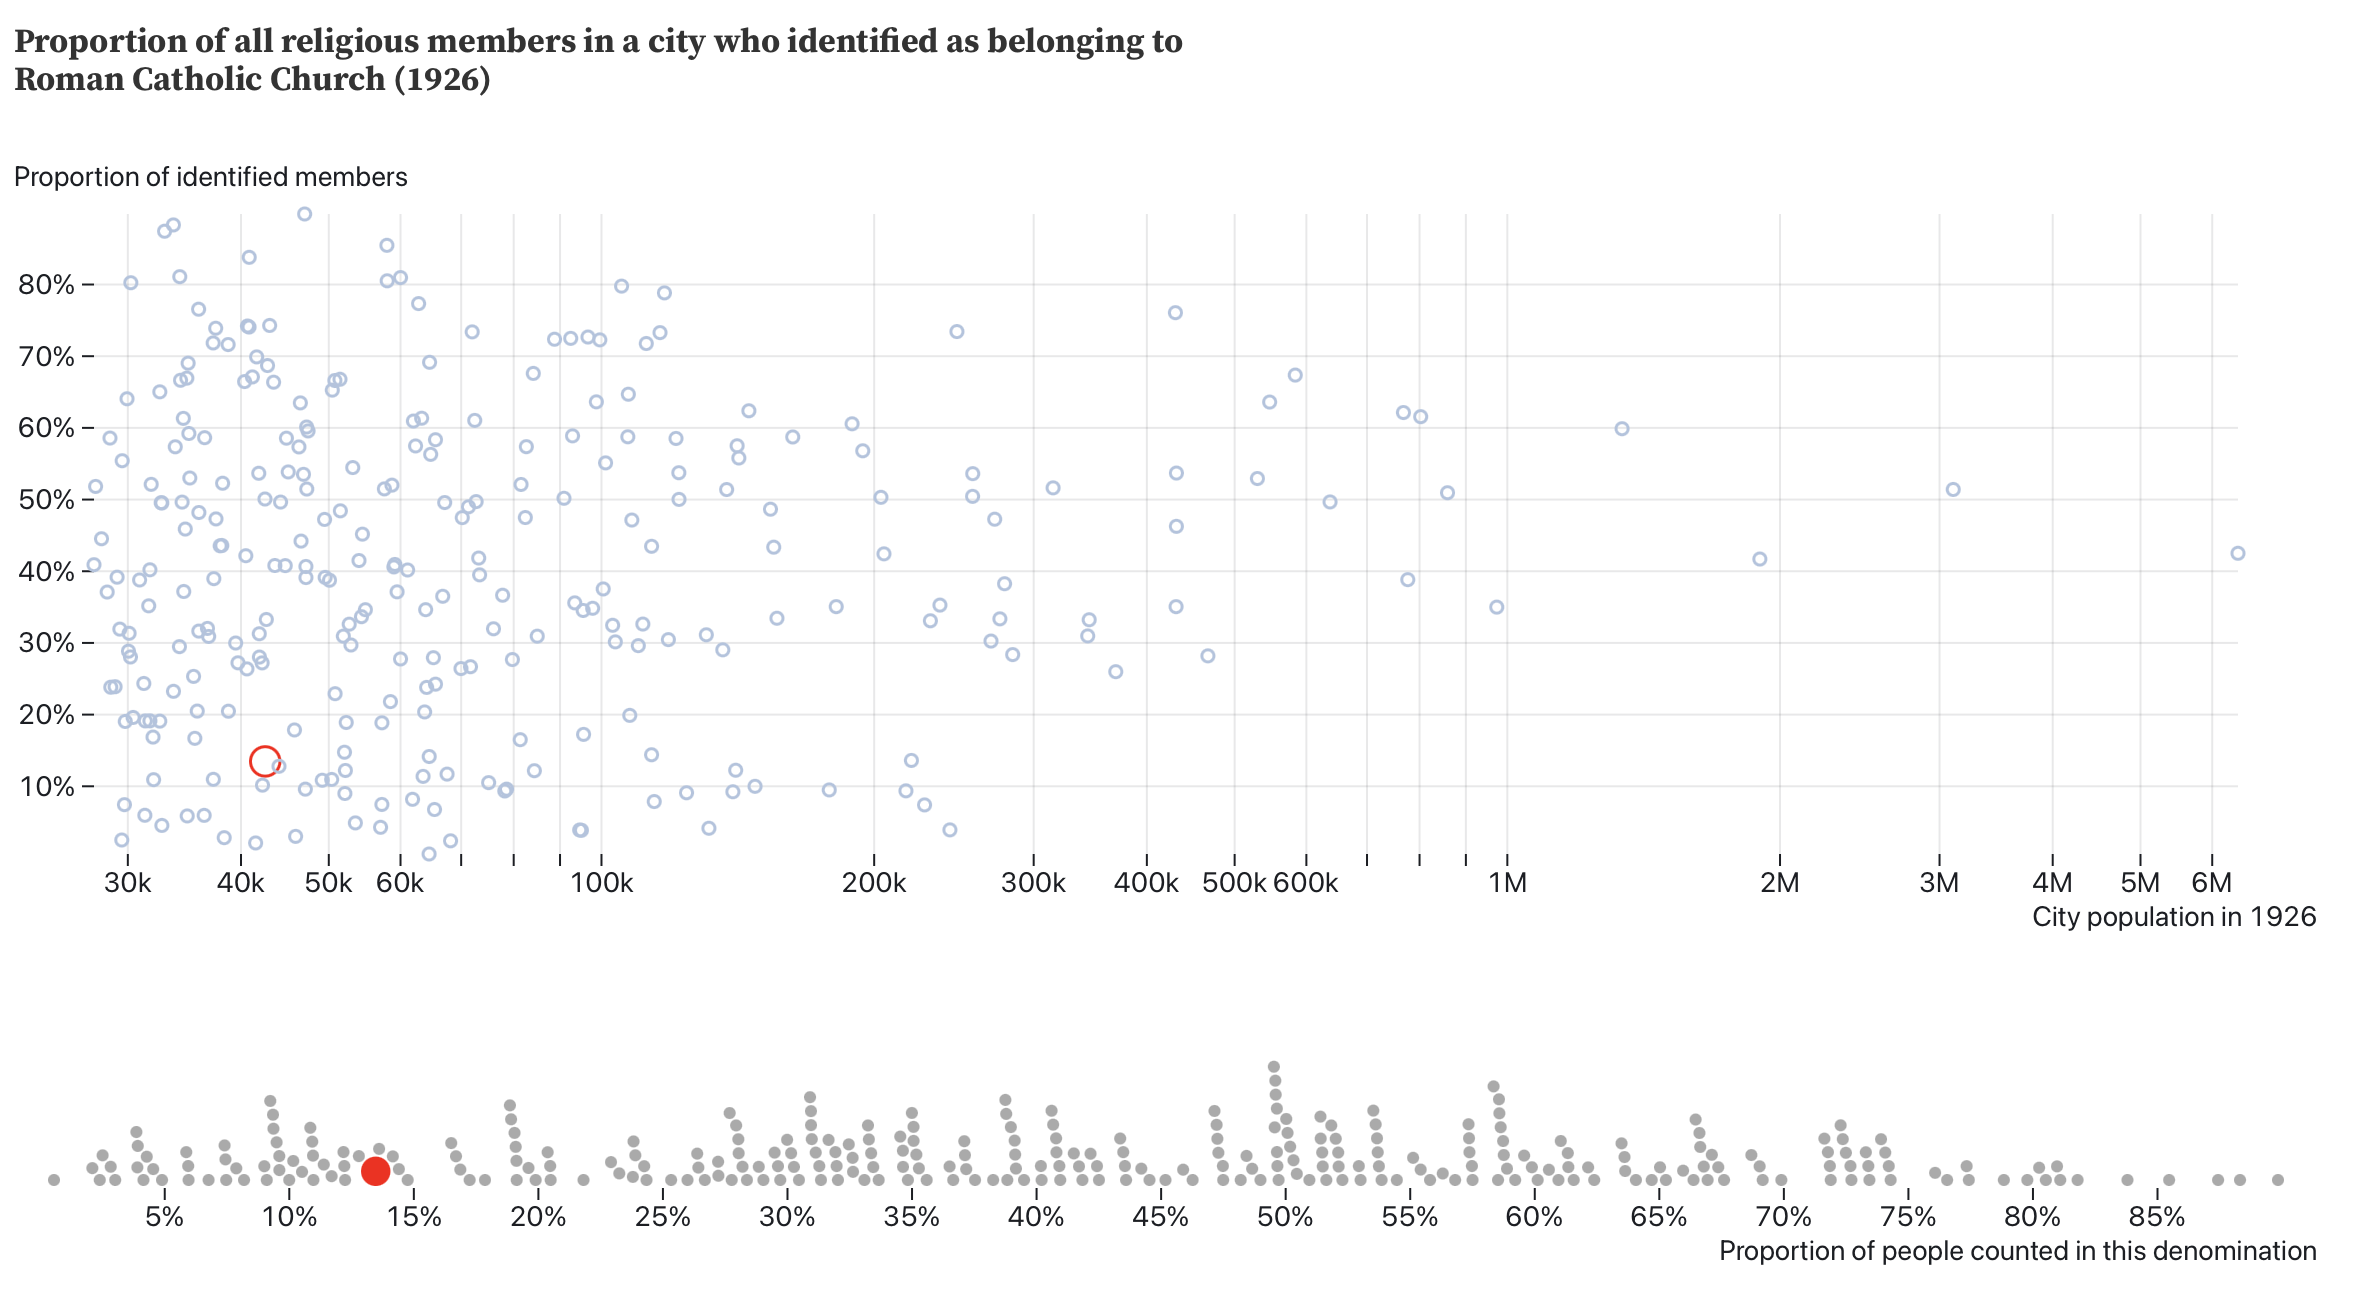
The proportion of Roman Catholics in Muncie in 1926.
These numbers are all very preliminary. And in particular, we are endeavoring to re-aggregate the data from the original schedules, rather than rely on the Census Bureau’s own aggregates. But they present an initial attempt at trying the understand how one city was typical or atypical in the number and kinds of religious denominations in that city.
See the website of Ball State University’s Center for Middletown Studies for more information. ↩︎