How the the Religious Bodies Census was first digitized ... in the 1920s
The primary reason that we are digitizing the schedules of the 1926 Census of Religious Bodies is to have access to the data they contain. But as we mentioned in a previous blog post, the schedules also contain many indications of how the Census Bureau processed them. Understanding that process is important to use the data correctly, but it is also interesting in its own right as a part of the history of how the federal state classified and counted religion. Using the clues on the schedules, we have been reverse-engineering how the Census Bureau processed all these forms.
One of the primary challenges facing the Census Bureau from the beginning was how to tabulate the results from the population census. This problem only became more difficult as the number of Americans grew rapidly and as the number of questions that the Census Bureau asked proliferated. To give you a sense of the scale of the work, the 1850 census—the pattern for subsequent, more detailed censuses—employed a large number of clerks totaling some 10 percent of the federal workforce in the nation’s capital.1
By the 1890 population census, however, the census had turned to mechanical means. The Census Bureau obtained tabulating machines from Herman Hollerith, who had developed an electric tabulating machine in the 1880s that read data from punchcards. The punch cards were fed through the machine multiple times to make different cross-tabulations of the data, counting the population not just by variables like sex or race but by the combinations of such variables.2 Hollerith’s Tabulating Machine Company eventually became one of the progenitors of International Business Machines, or IBM. And the basic process of tabulating the Census via such machines remained the same from the 1890 population census to the 1940 population census—the same period when the Census Bureau was conducting the Census of Religious Bodies.
Transferring the tabulation to Hollerith and IBM machines enabled the Bureau to produce more complex tables for the published reports. But using the machines likely created more human labor, not less. Workers—mostly women—had to laboriously transfer the data from the schedules to punch cards. Other workers had to operate the primitive tabulation machines, which were simple counters, by loading the correct cards and then further compiling their totals.
Markings on the census schedules contain many indications of the labor that was required to classify and tabulate the schedules. Below are a few of the more revealing examples.
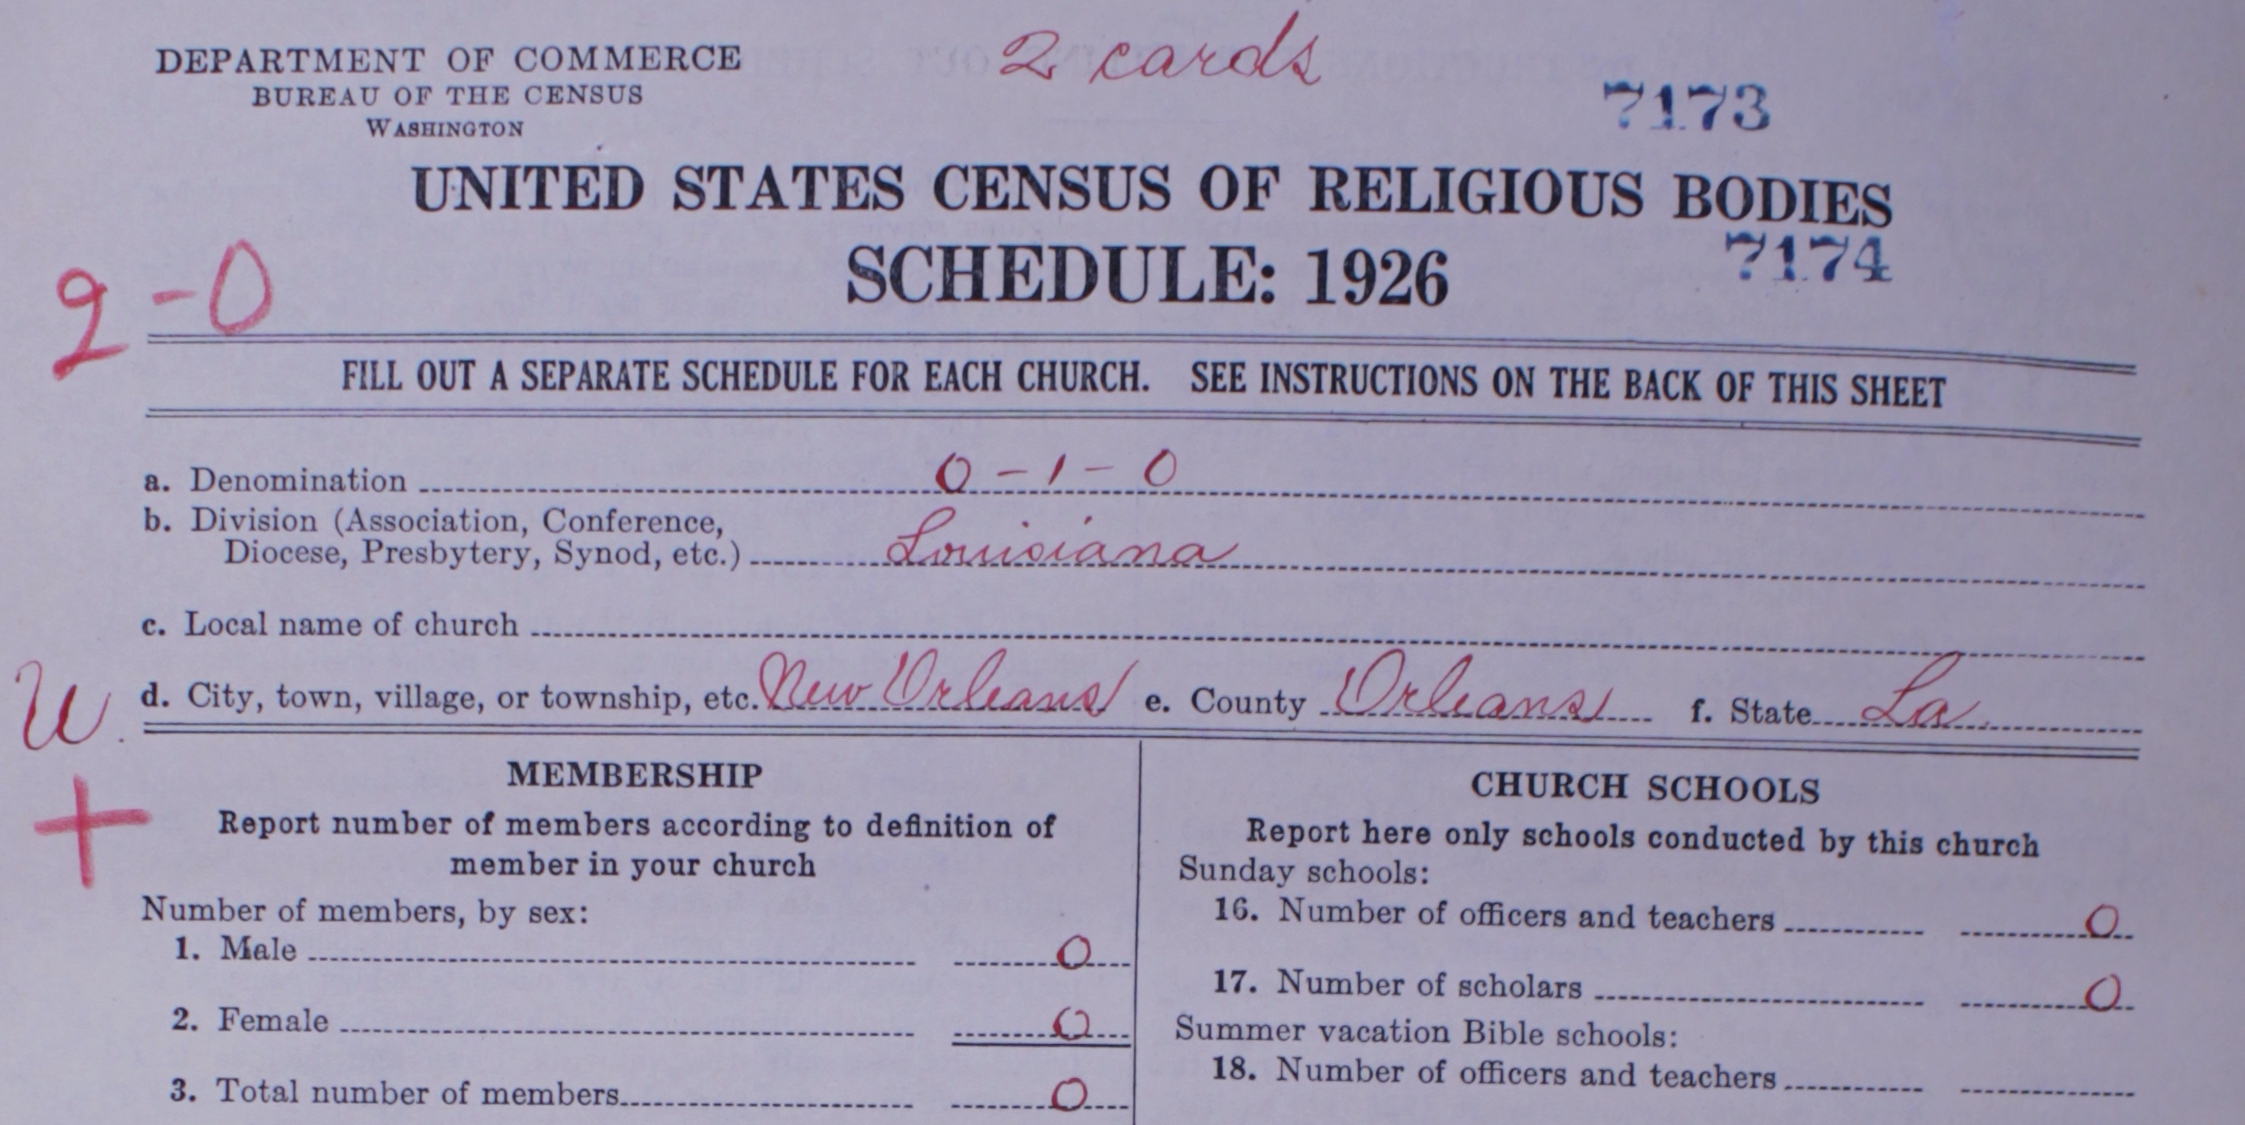
Figure 1. A schedule from a Southern Baptist mission in Louisiana.
This schedule from the Southern Baptist Convention contains the instruction “two cards” at the top, as well as two different schedule IDs: “7173” and “7174” (figure 1). A Louisiana mission had returned the information for two different congregations on the same schedule. To ensure that each congregation was counted, the Census Bureau transferred the information to two different cards but listed the number of members on one card as zero so the membership was not double-counted.
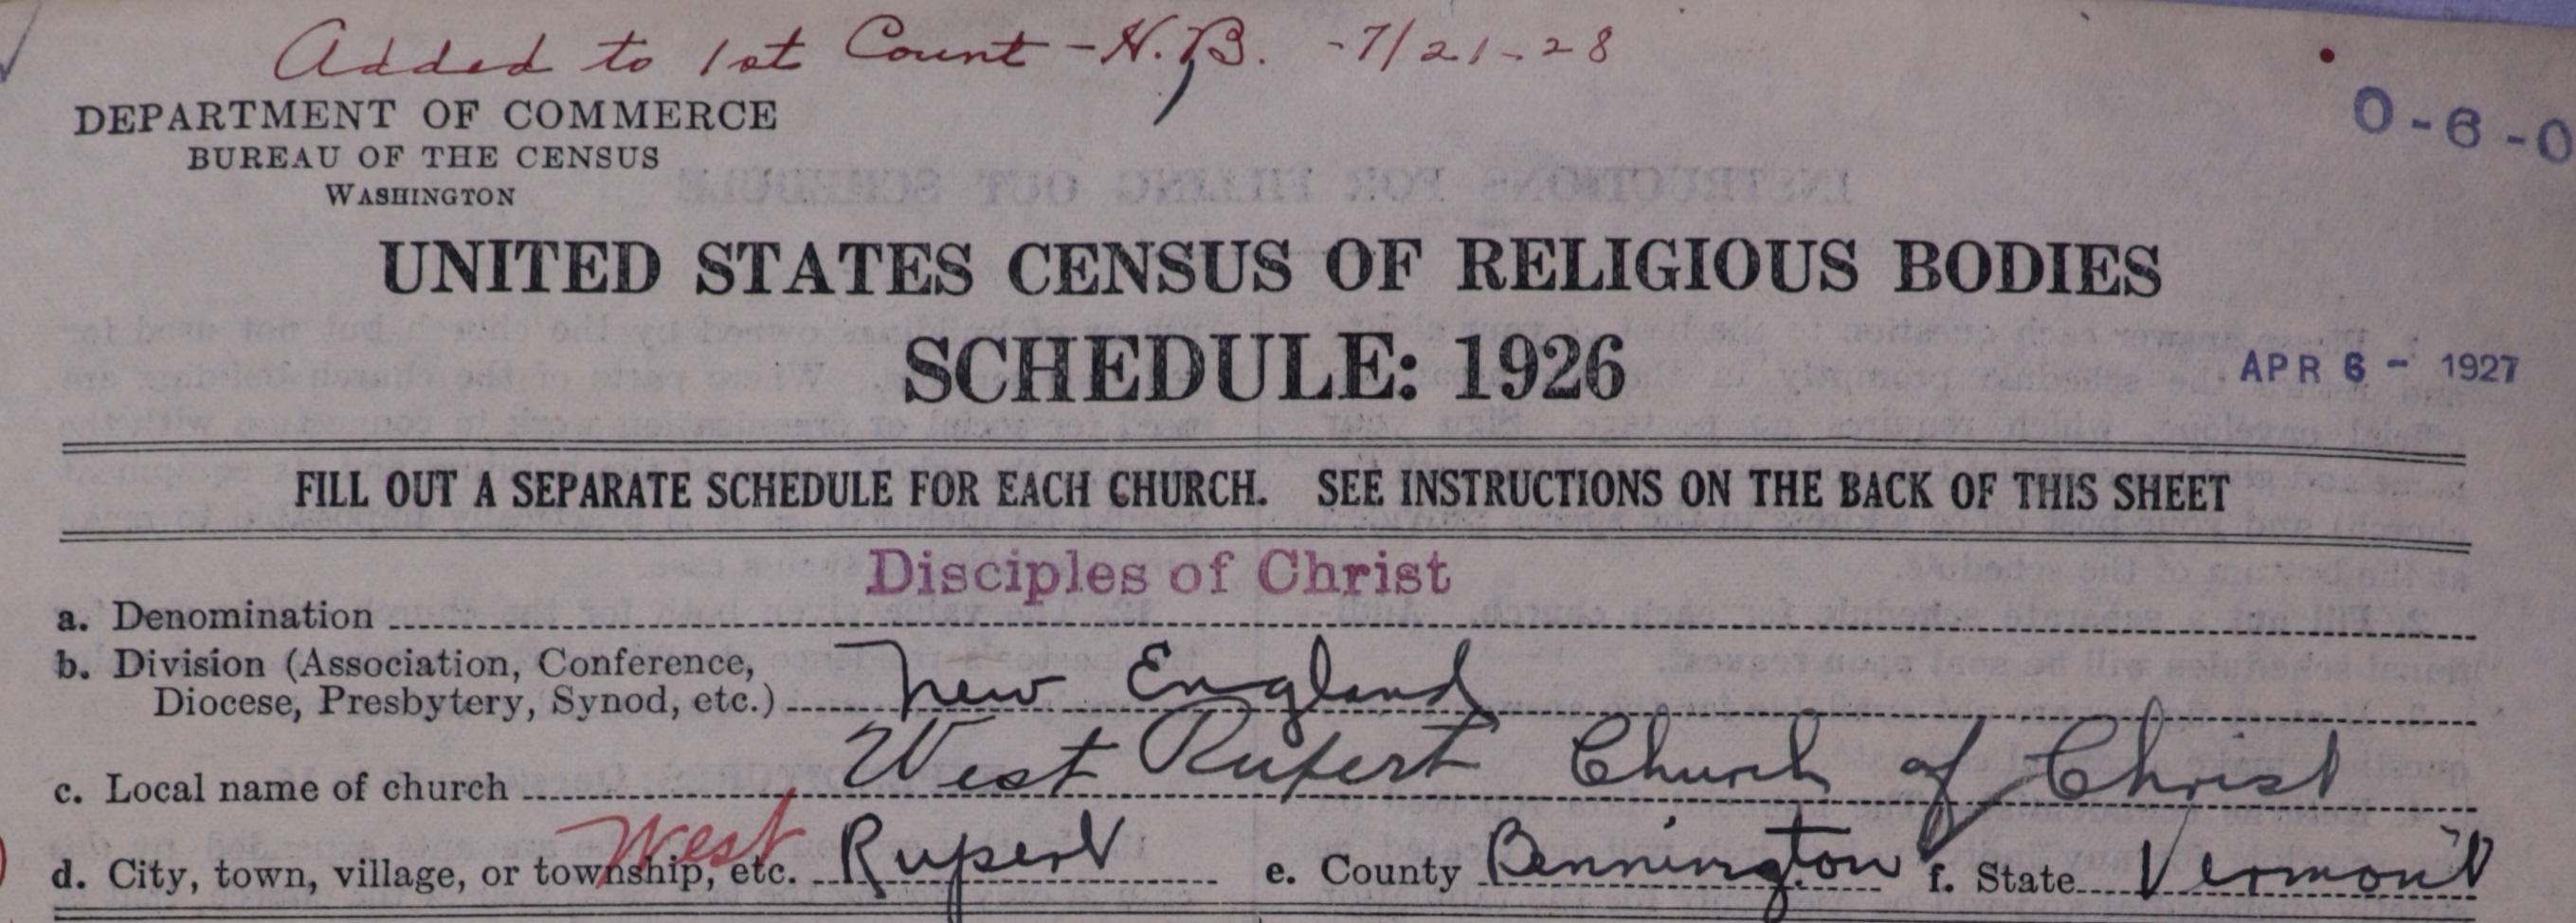
Figure 2. A schedule from a Disciples of Christ church in Vermont.
This schedule from the Disciples of Christ contains the note, “Added to the 1st Count - N. B. 7/21/28” (figure 2). For some reason, this schedule did not make it into the first tabulation. Possibly it was received after the first count had already been taken, though the schedule was received over a year before the problem was corrected. Whatever the reason, the Census Bureau had to deal with problematic schedules that were not correctly tabulated.
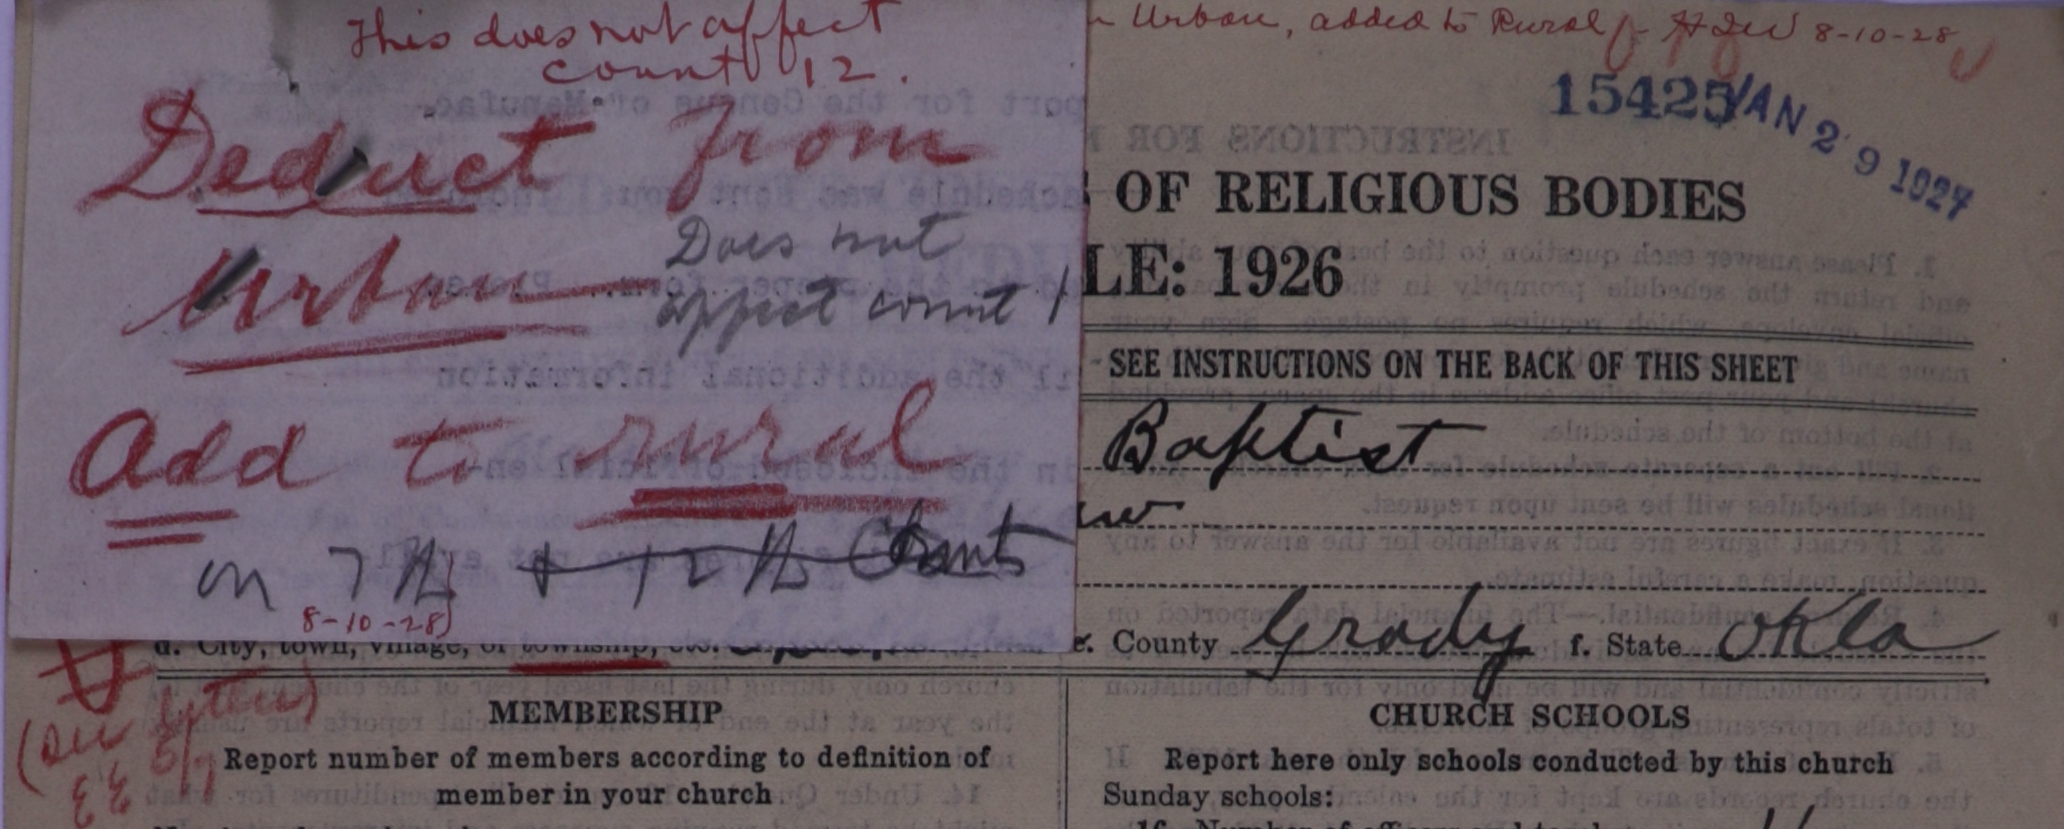
Figure 3. A schedule from a Baptist church in Oklahoma.
Such errors in tabulation were not always so easily resolved. This Baptist schedule had both notes written on it and pinned to it explaining how to correct an error (figure 3). The schedule had been mistakenly classified as urban and some of the tabulations had already occurred using that incorrect information. The schedule’s data was corrected on the tabulation that the Census Bureau labeled “7a.” That change did not affect “count 1,” presumably an initial total of the membership for the denomination regardless of urban or rural status. And there was some ambiguity about whether it would affect tabulation “12” or “12a.” As late as August 1928, over a year after the schedules had been received, the census was performing different kinds of cross-tabulation.
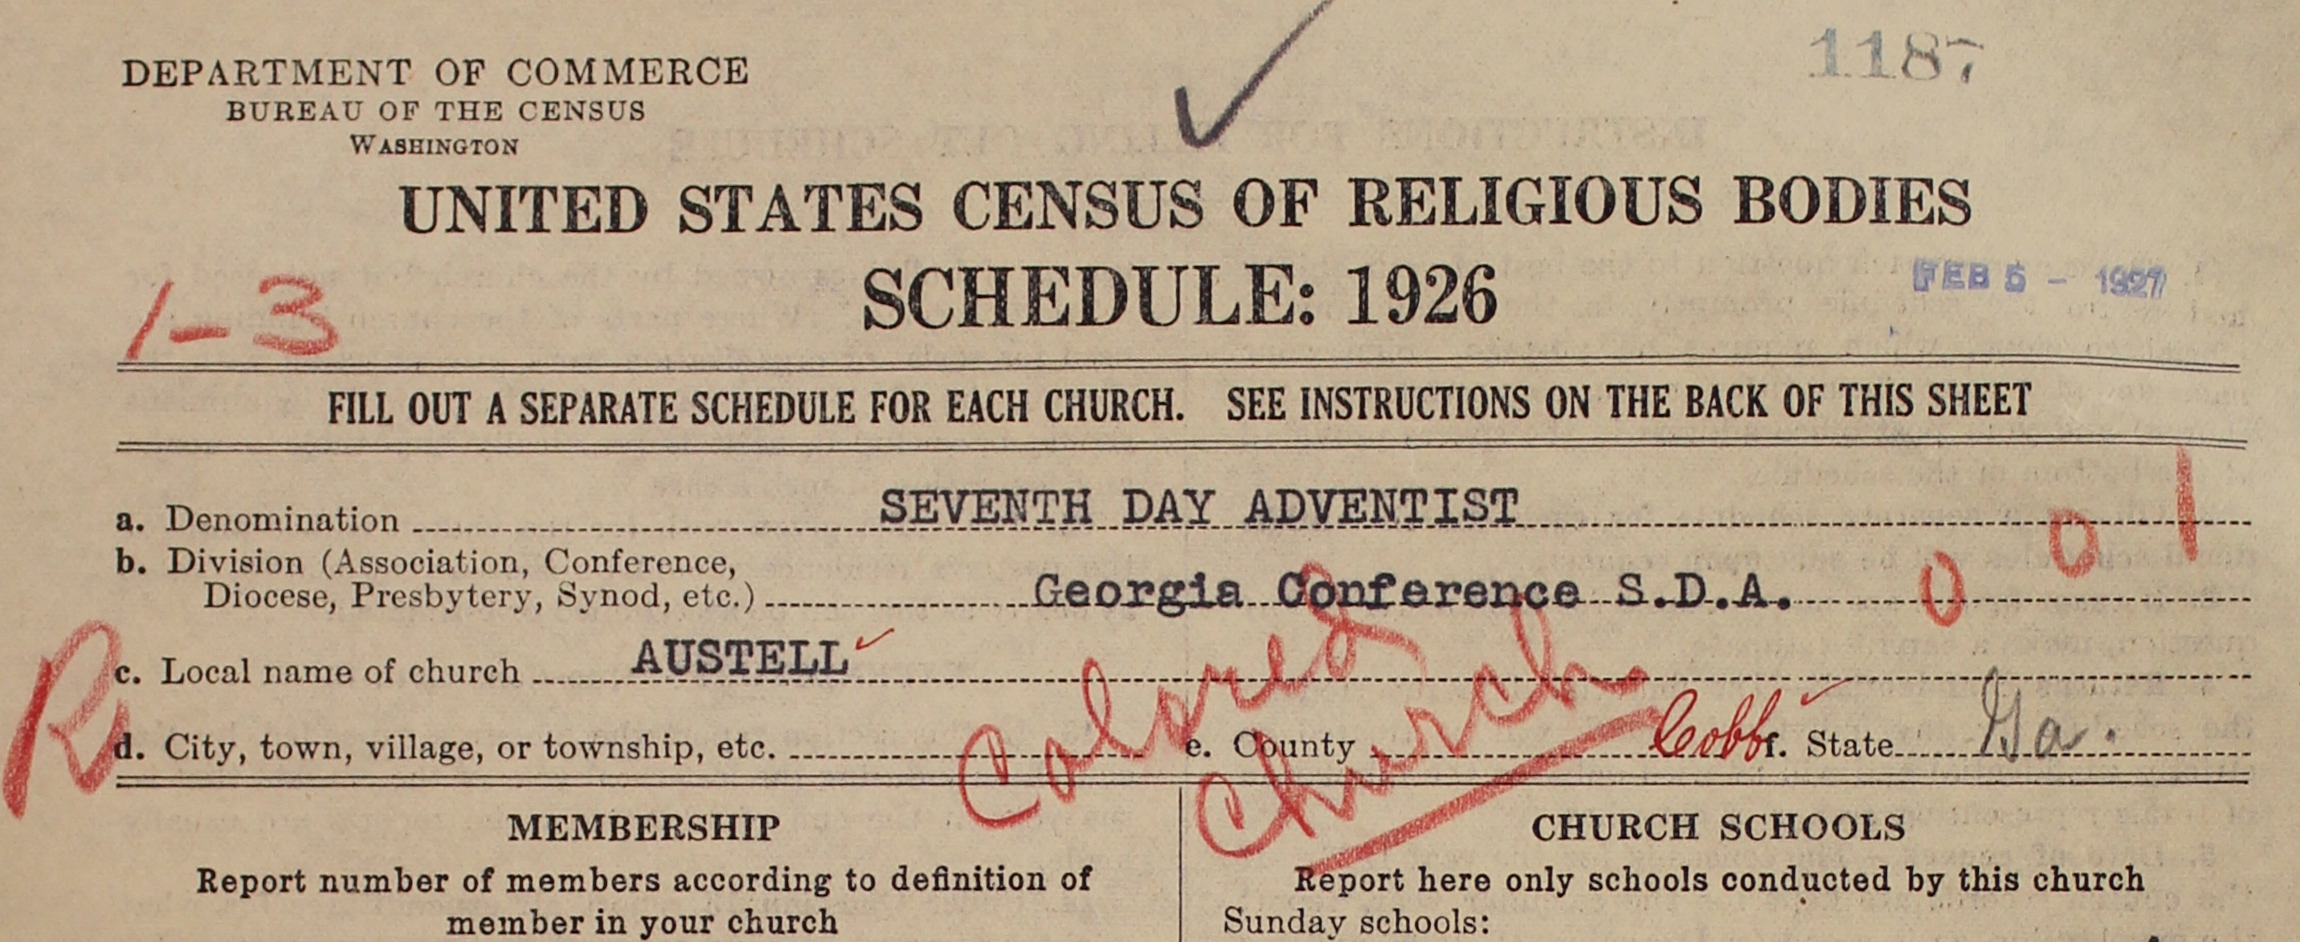
Figure 4. A schedule from a Seventh-day Adventist church in Georgia.
As the final—and most important example—take this schedule from a Seventh-day Adventist congregation (figure 4). The Census Bureau editor has written “Colored Church” across the section identifying the congregation. However, race was very much at the forefront of the Census Bureau’s concerns, and we can see here a clear example of the Bureau’s power to count and classify by race.3
The Census Bureau counted congregations rather than people by race when making its tabulations. In other words, the Census Bureau classified particular congregations as “Negro,” rather than counting the members of the congregation who were white or black. The census schedules themselves did not ask a question about the racial breakdown of the membership of congregations, though they did ask such questions about sex and race. Nor did the census schedules ask congregations as a whole to identify themselves by race. Rather, the Census Bureau assigned a racial classification to certain congregations itself, not unlike the way that they classified a congregation as rural or urban. The Census Bureau considered 24 denominations to be “exclusively Negro,” and so they counted each church in that denomination as “Negro.” The Census Bureau considered another 30 denominations to be “primarily white denominations [that] had one or more Negro churches among their number.” The schedule above (figure 4) is an example of a congregation that was classified as black from one of those denominations. We are still trying to figure out exactly what information the Census Bureau used to make such classifications. The Census Bureau reported that “no effort was made to enumerate the individual Negro members belonging to local white churches.”4
The effect of this system of classification and tabulation was that the only kind of black religious participation the Census Bureau counted were congregations or denominations that were exclusively, or at least predominantly, black. The Census Bureau was inconsistent with even that policy, deciding to exclude groups like black Muslims, or for that matter Buddhists, who could have fit within the “religious bodies” framework of the census.5
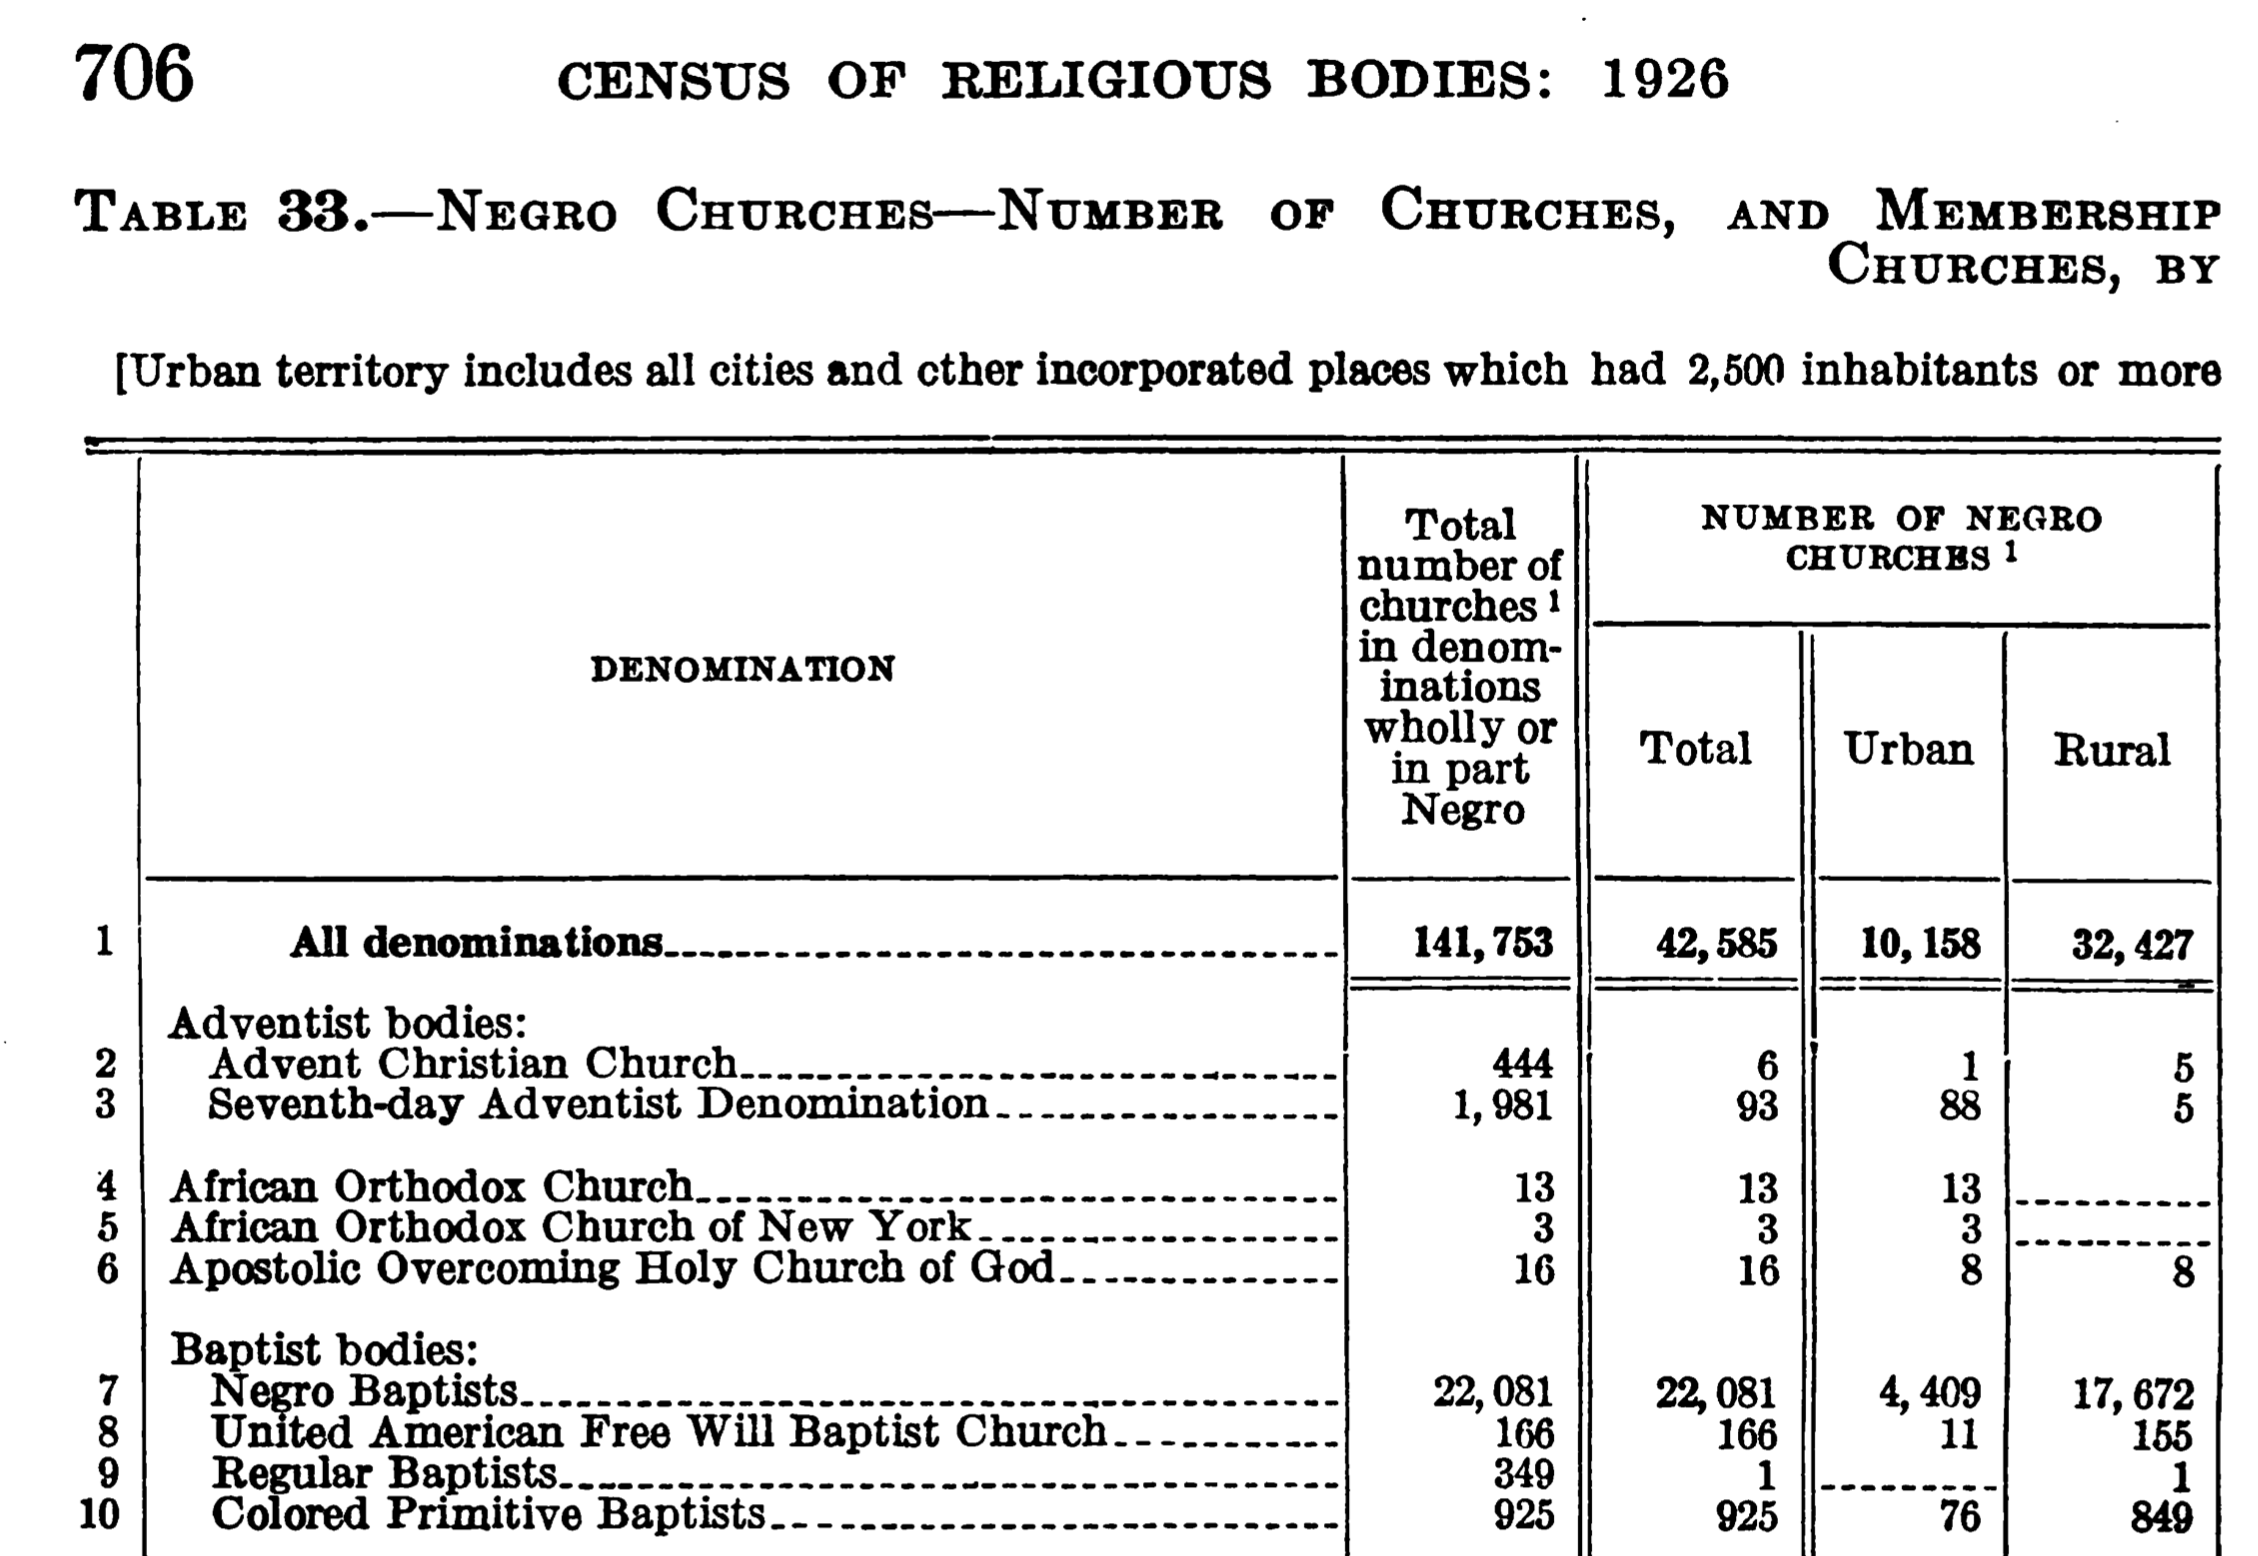
Figure 5. A detail from table 33 in the published census reports. Religious Bodies: 1926, Department of Commerce, Bureau of the Census (Government Printing Office, 1930), 2:706.
We can trace how the Seventh-day Adventist schedule mentioned above (figure 4) made it through the tabulation process. The Census Bureau classified 93 Seventh-day Adventist congregations as black, including that one. The Bureau did not report that breakdown of congregations by race in the reports on individual denominations. Rather, they confined that information to the overview report and detailed tables on “Negro Churches” (figure 5).
The American Religious Ecologies project is digitizing the 1926 census, both in the sense that we are photographing the schedules and in the sense that we are transcribing them into a dataset. Understanding the Census Bureau’s process of classification and counting is essential to correctly use the data for our purposes. The punchline, though, is that in a sense we aren’t the first to digitize the census: punch cards are a digital rather than analog medium, and so the Census Bureau beat us to the punch by over 90 years.
Margo J. Anderson, The American Census: A Social History, 2nd ed. (Yale University Press, 2015), 51–58. ↩︎
Anderson, American Census, 104–110; Paul Schor, Counting Americans: How the U.S. Census Classified the Nation (Oxford University Press, 2017), 146–147, 256–257; Joseph J. Salvo, “Data Capture,” in Encyclopedia of the U.S. Census, edited by Margo J. Anderson, Constance F. Citro, and Joseph J. Salvo (CQ Press, 2012): http://dx.doi.org/10.4135/9781452225272.n32. ↩︎
See in particular Schor, Counting Americans. ↩︎
Religious Bodies: 1926, Department of Commerce, Bureau of the Census (Government Printing Office, 1930), 1:69. See also the notes on pp. 1:288–290, which detail some of the complexities of how the Census Bureau counted congregations under different denominational and racial designations. ↩︎
On religio-racial groups and the population census, see Judith Weisenfeld, New World A-Coming: Black Religion and Racial Identity During the Great Migration (NYU Press, 2017), ch. 6. ↩︎